Your software knows what happened. We tell you what’s next.
Regional directors pull reports from eight systems into one spreadsheet. Purchasing managers forecast with gut feel. Owners find out a location underperformed 45 days after it happened.

The invisible tax on operations
The spreadsheet ritual
Every Monday morning: log into 8 systems, pull reports, copy data into a master spreadsheet, format it, email it. Four hours. Every week. Information the software already has.
Blind between closes
An owner with 6 locations finds out on the 15th that Store #3 had a terrible month. 45 days after the problem started. The tools record transactions — they don't surface performance.
Gut-feel forecasting
"We order 20% extra just to be safe." Margin burned on insurance against uncertainty. ERPs show what's on the shelf. Nothing predicts what's needed next month.













Our Solutions
InventoryIQ
Stop burning margin on guesswork.
- →Demand forecasting that learns your seasonal patterns
- →Lead time intelligence — know when suppliers slip before it costs you
- →Margin-aware reorder — never over-order "just to be safe" again
OpsPulse
Six locations shouldn’t mean six Monday mornings.
- →Aggregate Opera, Maestro, and Cloudbeds into one view
- →Weekly digest — what happened, what's trending, what needs attention
- →Anomaly alerts — revenue dips, occupancy drops, cost spikes
ACO
Your store is invisible to the shoppers that matter.
- →Full catalog audit — every product, every image, every data field
- →Visibility Score (0–100) per product with ranked priorities
- →9-point AI discoverability check
How we work
90-minute diagnostic
We shadow your Monday morning. See the spreadsheets, the system logins, the manual exports. Map the exact minutes and dollars lost — not estimates, your numbers.
You get a report. Not a pitch.
Numbers. "You're losing X hours per week on Y. Here's what it costs." No proposal. No commitment. Just facts you can act on with or without us.
If you want it fixed, we build.
If the numbers make sense, we build the solution. If not, you still have the diagnostic. No cost. No risk. You decide what happens next.
Built for operators, not hype.
We’re not a venture-backed startup burning runway on hype. We build capital-efficient, customer-funded solutions for qualified buyers in validated industries. Built by operators who’ve managed 6-location portfolios and $12M+ supply chains.
Get a diagnosticInsights from the front line
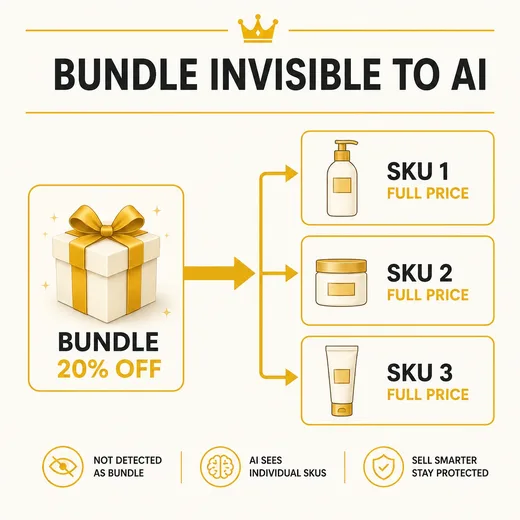
Why Do AI Shoppers Ignore Your Bundles and Quote Full Price?
AI shopping assistants ignore bundles and quote full price because the bundle discount never makes it into structured data. Shopify's schema marks each component SKU at its own full price, so the machine reads three items instead of one discounted offer. Here is what that blindness costs DTC brands.
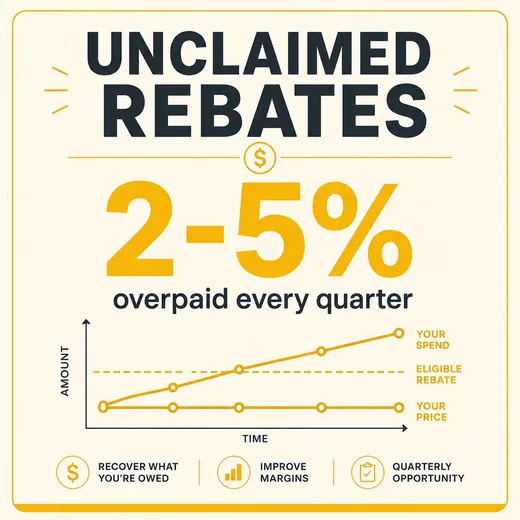
Why Do Distributors Leave Volume Rebates Unclaimed Every Quarter?
Distributors leave volume rebates unclaimed every quarter because the ERP records each purchase order as its own transaction and never tracks cumulative spend against the negotiated tier. A $15 million distributor with $8 million in contracted spend pays $160,000 to $400,000 a year above its own negotiated rates. Here is what cumulative spend-to-tier visibility recovers.
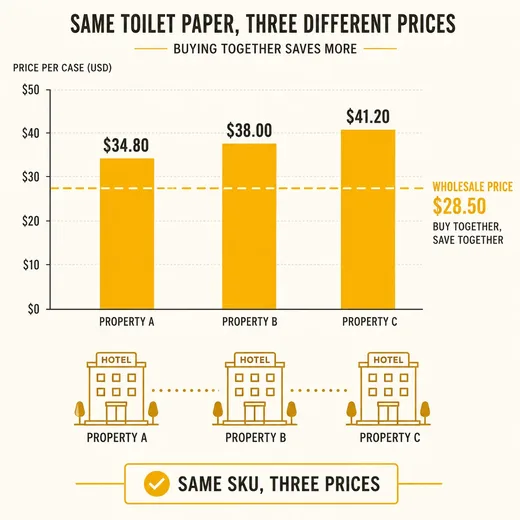
Why Do Hotel Groups Pay Retail Prices for Wholesale Volume?
Hotel groups pay retail prices for wholesale volume because every property buys alone and nothing connects the purchases. A 10-property group overpays $48K-$112K a year on recurring supplies while volume discounts never materialize. Here is what cross-property spend visibility recovers.