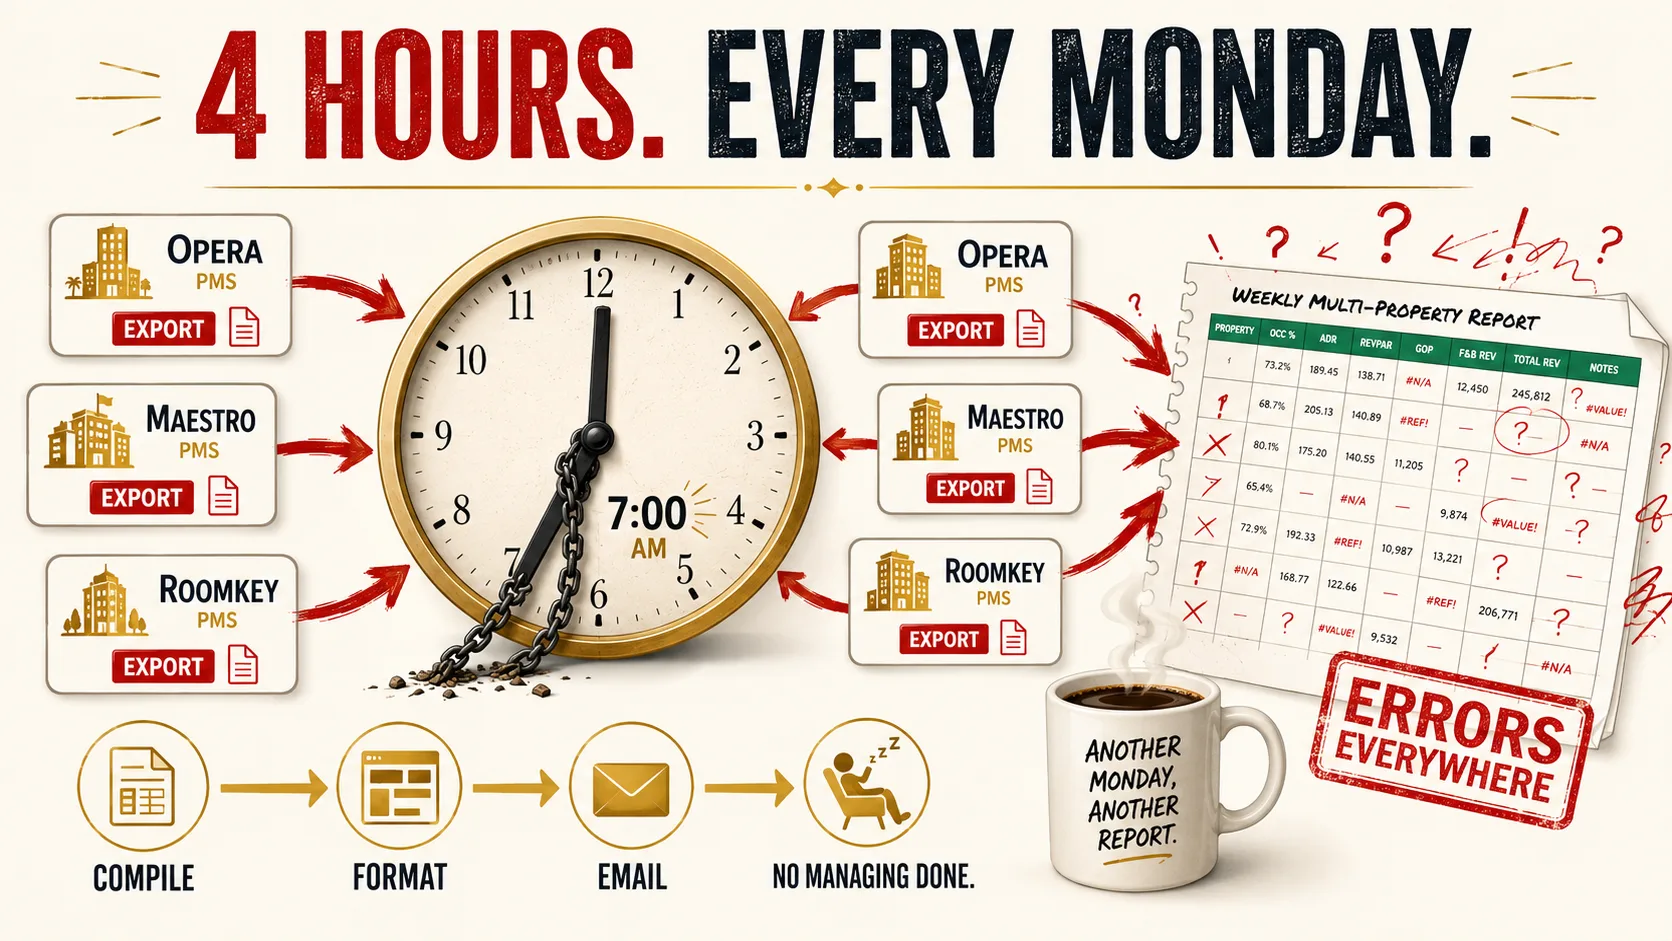
The Monday morning report takes four hours because the tools were never built to combine them. Each PMS exports separately, each calls the same metric something different, and someone has to reconcile six formats into one spreadsheet before any actual work begins.
If this is your Monday morning, you already know the drill. Log into Opera for Property 1. Export the weekly report. Log into Maestro for Property 2. Export. RoomKey for Property 3. Export. Copy all six exports into the master spreadsheet. Format. Reconcile the naming differences because each PMS calls RevPAR something slightly different, or measures occupancy from a different denominator. Email the final report. Four hours later, you've done no managing, just compiling.
Every Regional Director of Operations managing 6 to 20 properties has lived this. It's not a bad week. It's their calendar. Every Monday. Before any actual work begins.
Your PMS Wasn't Built for This
Property Management Systems like Opera, Maestro, RoomKey, and Cloudbeds are property-level tools. They were architected to handle reservations, check-ins, housekeeping assignments, and folio billing. They do that well. They were never architected to answer the question you actually need answered: "Across all 12 properties, which one had the worst RevPAR this week — and why?"
The data exists. Every PMS captures occupancy, ADR, RevPAR, GOPPAR. It's all there, separated across a dozen databases, each with its own schema, its own export format, its own definition of a "week." The information you need to manage your portfolio is trapped, not missing, just trapped behind system boundaries that were never designed to be crossed. This is the gap multi-property intelligence closes: reading across systems without replacing them.
This isn't a bug. It's what PMSs were procured to do. The front desk manager needed software that processed check-ins. The GM needed a housekeeping report. Nobody at procurement asked: "Can this show me all six properties at once?" Because at the time, that wasn't the problem anyone was solving.
What Those 4 Hours Actually Cost
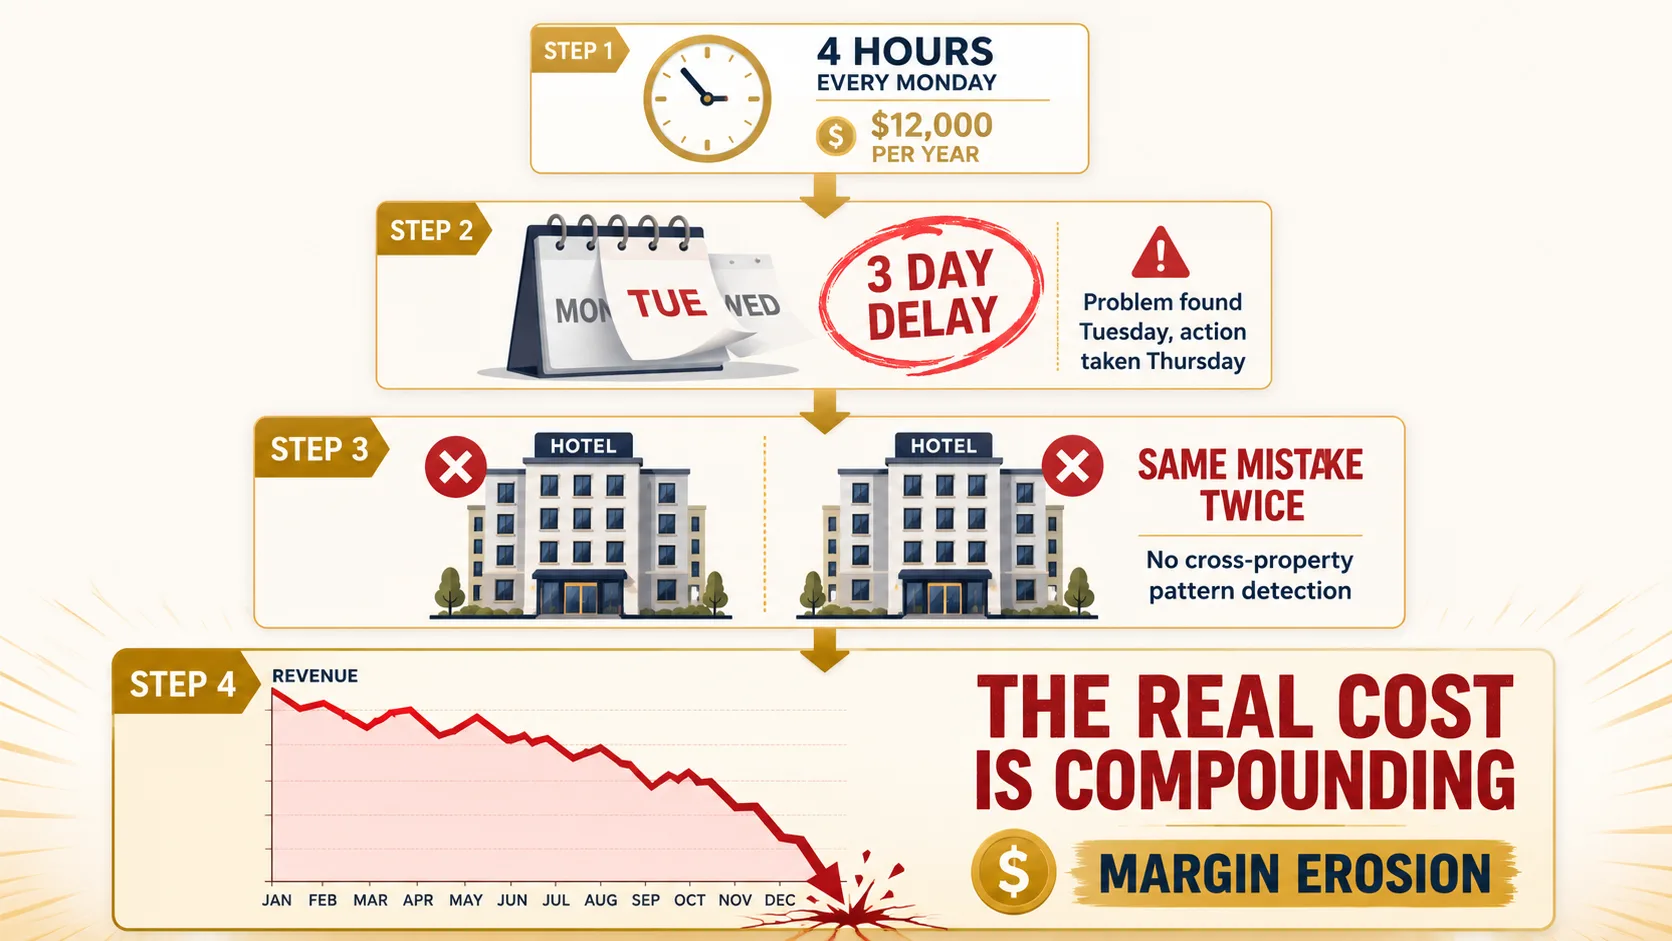
The obvious cost is labor. Four hours per week at a director-level rate, call it $50 to $70 per hour, lands at $200 to $280 per week. Over a year, that's roughly $12,000 spent on copying and pasting data between systems that already contain it.
But that's not the number that matters.
The real cost is reaction time. By the time the Monday report is compiled, formatted, and distributed on Tuesday morning, the problems it surfaces are already aging. A property that ran at 52% occupancy on Monday-Tuesday is still bleeding on Wednesday while the report sits in an inbox. The Regional Director doesn't call that GM until Thursday. That's three days of avoidable revenue loss per property, per incident.
And then there's the compounding cost: the patterns nobody sees because nobody has the cross-property view. Property 3 ran a promotion that cratered ADR. Property 6 tried the same promotion three months later with the same result because nobody connected the dots. Without consolidated visibility, the same mistakes repeat at different properties. The organization pays for each one, and nobody knows they're connected.
Why the Industry Accepts This
The alternatives haven't been better, so the spreadsheet ritual survives not because it works, but because nothing else fits the mid-market.
Business intelligence tools like Tableau and Power BI can consolidate data from multiple sources. They also require a data team to set up connectors, maintain pipelines, and build dashboards. Most 6-to-20-property management groups don't have one. They have a Regional Director and an Excel workbook.
Enterprise platforms like M3 and Aptech serve the other end of the market, portfolios of 50-plus properties with centralized accounting departments. These systems are built for enterprise consolidation: financial reporting, not operations. They assume standardized PMSs, centralized IT, and dedicated analysts. Mid-market operators fall through the cracks, too big to run on gut feel, too small to afford an enterprise deployment. TheiaOps was built for this gap: validating which markets are underserved before building anything.
So the Monday morning ritual endures. Four hours of copy-paste. Every week. Because the market hasn't offered anything designed for the operator managing 8 properties across three PMS brands.
What Changes When You See Across Properties
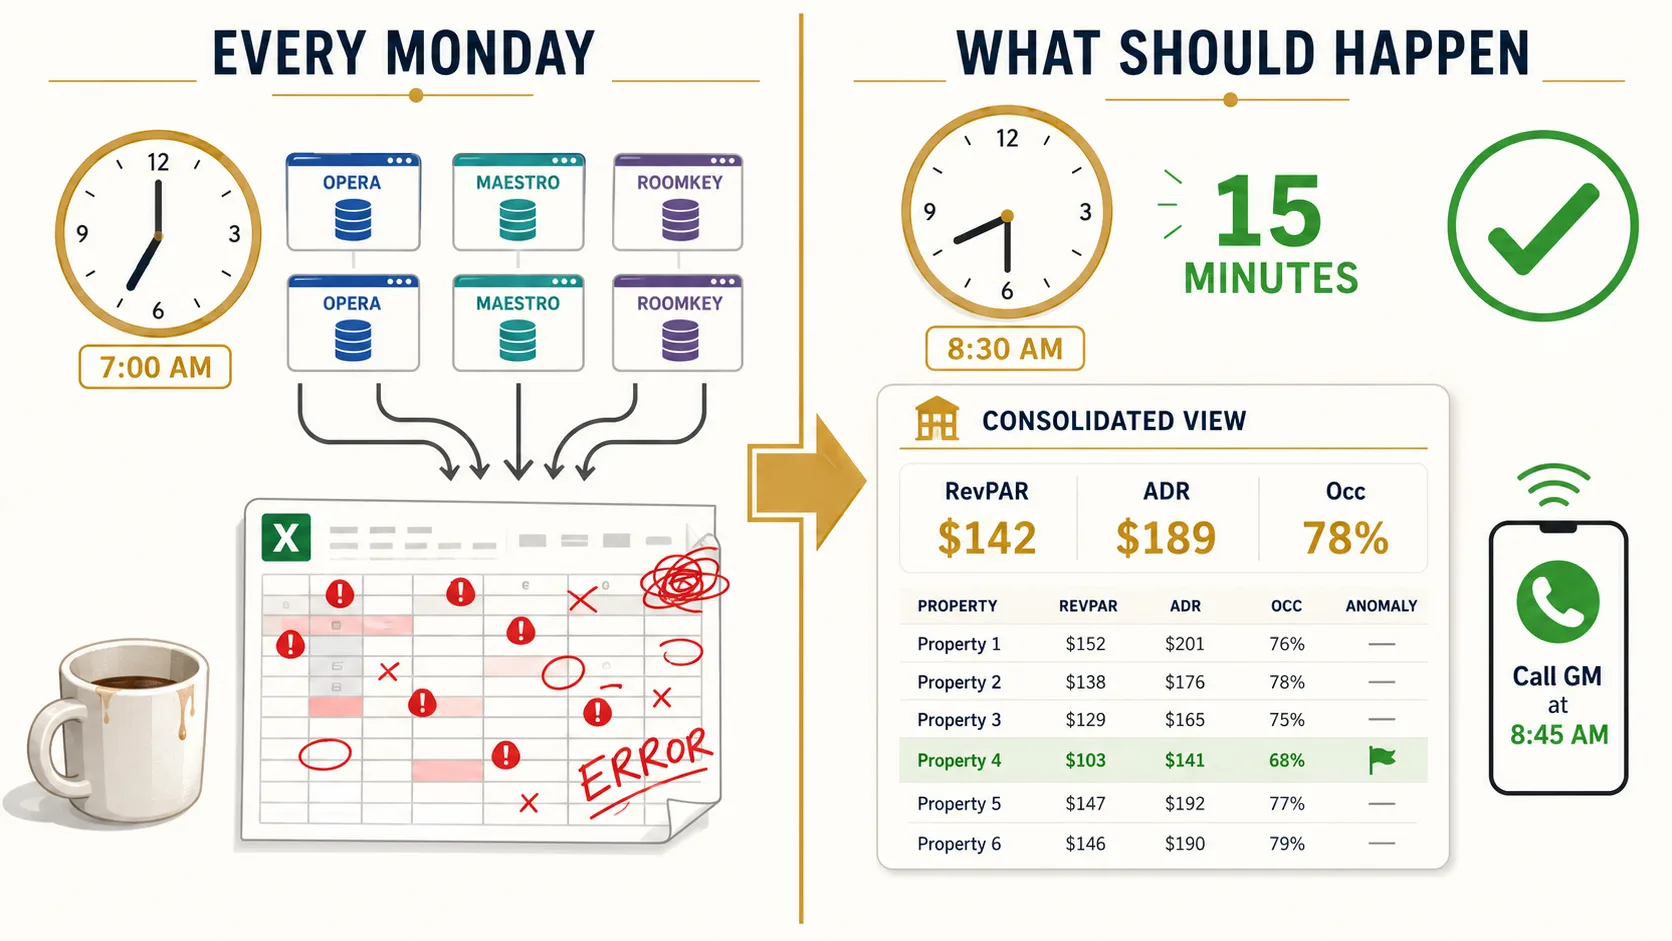
Now imagine a different Monday morning. You open one view. It shows every property's occupancy, RevPAR, and ADR, normalized, regardless of which PMS each property runs. The anomaly at Property 4 is already flagged: RevPAR down 12% against its own 12-week trend, occupancy slippage concentrated in midweek. The system surfaced it before you finished your coffee. You call that GM at 8:45 AM, not Thursday at 3 PM.
The outcome isn't "better analytics." It's Monday mornings back. Fifteen minutes reviewing what the system already surfaced, then actual management work: coaching GMs, analyzing the flagged anomaly, making decisions. The spreadsheet becomes unnecessary not because you automated it, but because the question it was answering is now obsolete.
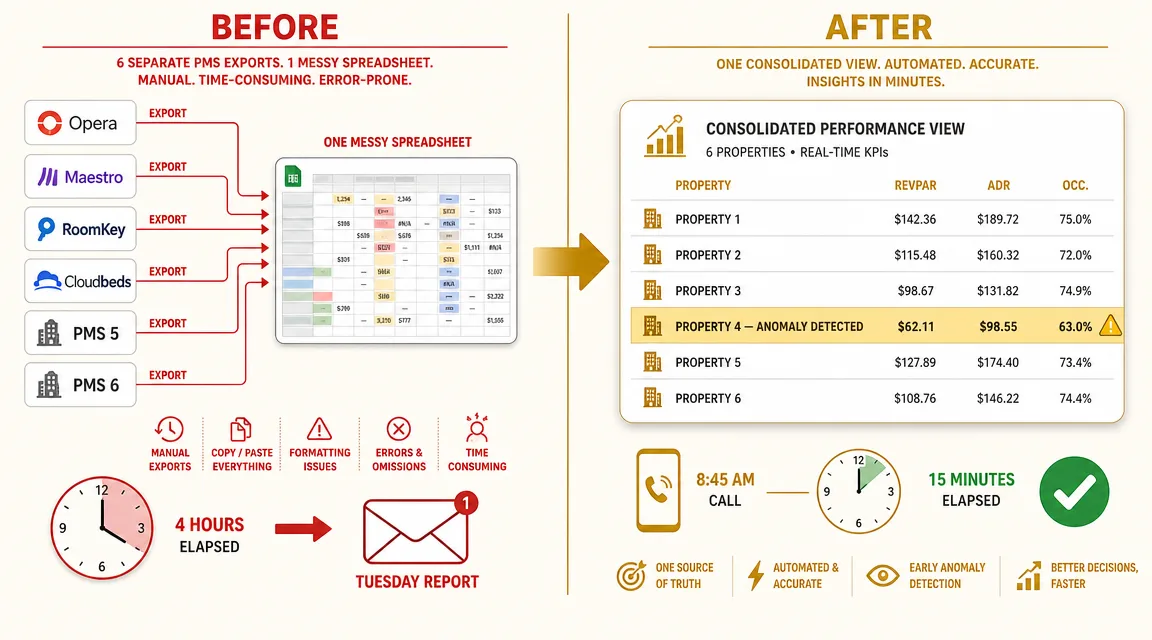
This isn't another report. It's the view your PMSs were never designed to provide, across properties, across brands, in real time, built for the operator who manages a portfolio, not just a property. And it runs on top of existing systems. No rip-and-replace.
What to ask next
Common questions operators ask after reading this:
How do I consolidate KPIs from Opera, Maestro, and RoomKey into one report?
What does cross-property anomaly detection look like in practice for a 12-hotel portfolio?
Can I get normalized RevPAR and ADR across properties running different PMS systems?
Related read: The same mid-market gap appears in medical supply distribution — where expiry-driven write-offs cost distributors 8–12% of inventory value because ERPs can't read shelf-life against demand.
Related read: The coordination gap isn't limited to reporting — manual task handoffs between front desk, maintenance, and housekeeping waste 22–28% of labor hours at mid-market hotel groups, hidden entirely from property-level tools.
Related read: The same property-siloed architecture isolates housekeeping labor across hotels — housekeeping labor imbalances cost hotel groups $78,000 to $89,000 per year in overtime, comps, and turnover that cross-property visibility would catch at 7 AM.
Related read: The Monday spreadsheet ritual is a symptom. Rate parity fails inside hotel groups when PMS systems cannot see cross-property price conflicts — every manual report hides a problem the architecture never asks about.
If This Sounds Like Your Monday Morning
We analyze multi-property operations to find the waste your systems can't see. It starts with a diagnostic — we shadow your Monday morning, map exactly where the time goes, and quantify what the delay is costing you across your portfolio. No pitch. Just numbers.