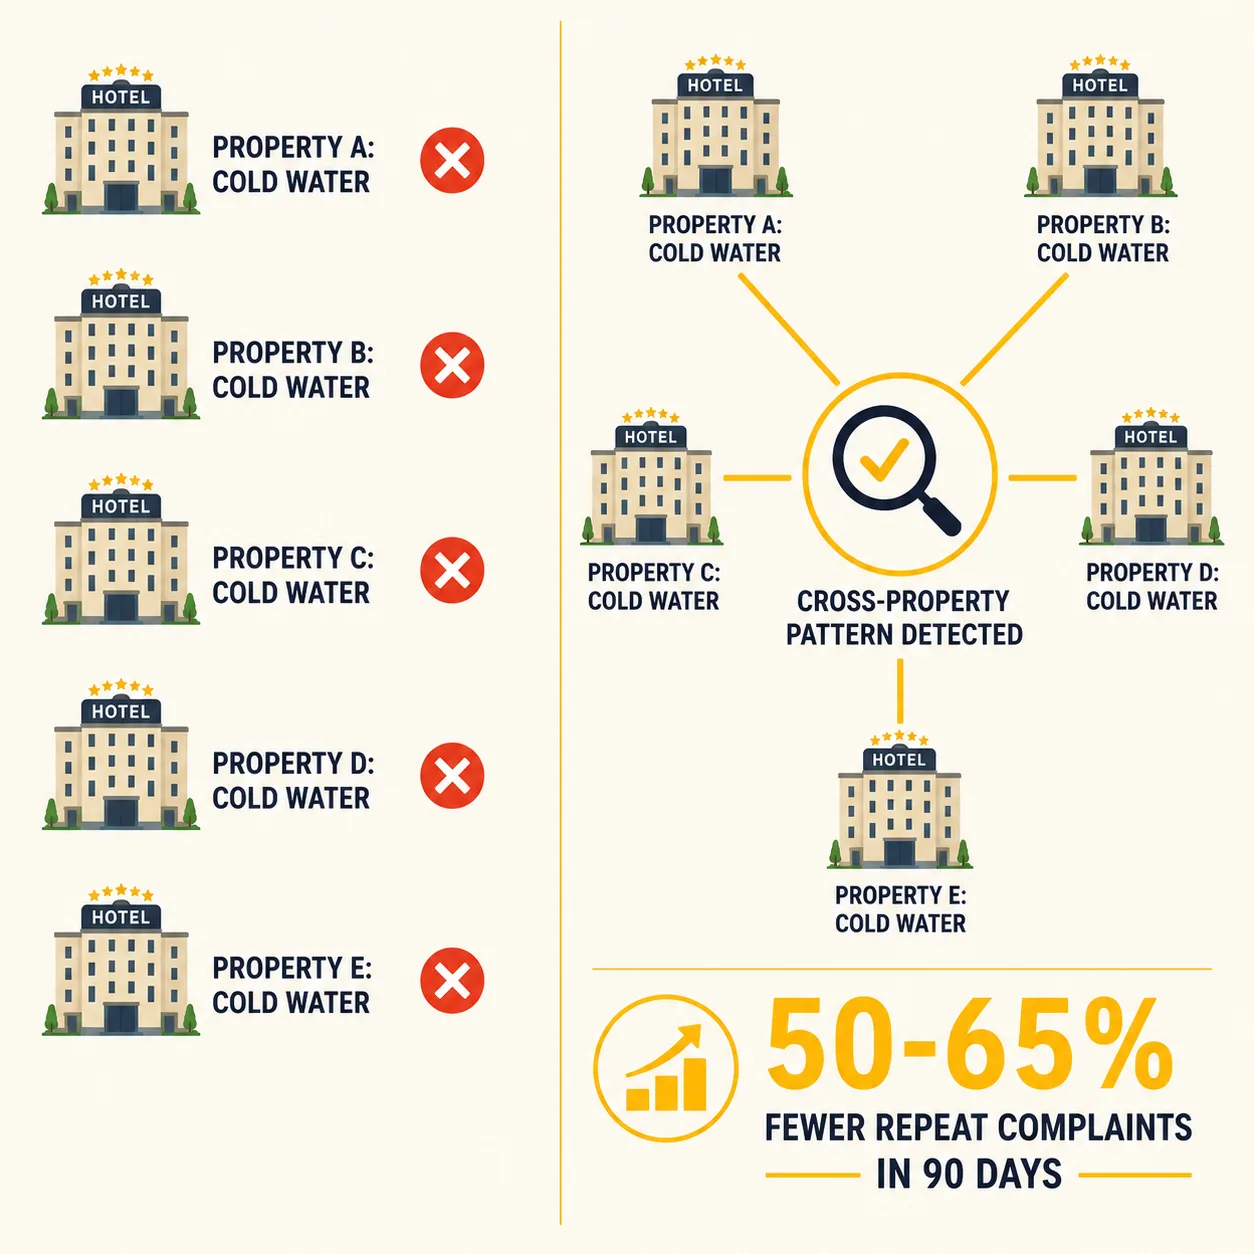
The same guest complaint repeats at every property because each property runs its own complaint log, and resolved means closed, never prevented. No hot water at the downtown property, the airport property last week, the suburban property two weeks before that, and no system connects the dots.
A front desk agent at the downtown property logs a complaint. No hot water. Again. The manager comps the room and closes the ticket. The airport property had the same complaint last week. The suburban property, two weeks before that. Nobody knows. The guest who stayed at both the downtown and airport properties last month? She booked the competing chain this quarter. They know her by name there. Nobody here connected the dots. Each property runs its own complaint log. "Resolved" means "closed." It never means "prevented."
Why PMS and CRM Tools Miss the Pattern
Hotel Property Management Systems like Oracle Opera, Mews, and Cloudbeds handle reservations, billing, and room assignments. They log guest complaints as incident tickets. Room 314 reports no hot water. The ticket is created. The front desk notes it. The manager closes it. The ticket goes into the property's PMS. It does not go anywhere else. Property 2 does not see it. Property 6 does not see it. The Regional Director who oversees all 12 properties does not see it.
The PMS was built to manage a single hotel. Multi-property was added later as a reporting view. A Regional Director can pull an occupancy report across 12 properties. They cannot pull a complaint category report across 12 properties. The data exists per property in 12 separate complaint logs. It has never been asked the cross-property question. The architecture was never designed to ask it. This is the same structural gap that makes the same HVAC compressor fail at three properties before anyone notices. Same root cause. Different symptom. The system sees units in isolation. It never sees the relationship between them.
Customer Relationship Management tools like Revinate and Guestfolio pull sentiment from post-stay surveys and online reviews. They tell a hotel group what guests felt after they left. They surface trending satisfaction scores. They flag declining review ratings. They do not categorize complaints by root cause type. They do not track resolution outcomes. They do not ask whether the cold water complaint at the downtown property is the same cold water complaint the airport property logged six days earlier. Revinate's own marketing positions the tool for cross-property guest profile visibility, not cross-property complaint pattern detection. Guest profiles. Not complaint categories. The distinction matters.
Complaint management tools like Quore track guest issues at the property level. They log complaints. They track resolution. They measure response times. They do everything a single-property complaint system is supposed to do. What they do not do is ask: "Has this same complaint type appeared at another property in the portfolio?" The question does not occur to them because it does not occur to their architecture. They are property management tools. A portfolio is not a property.
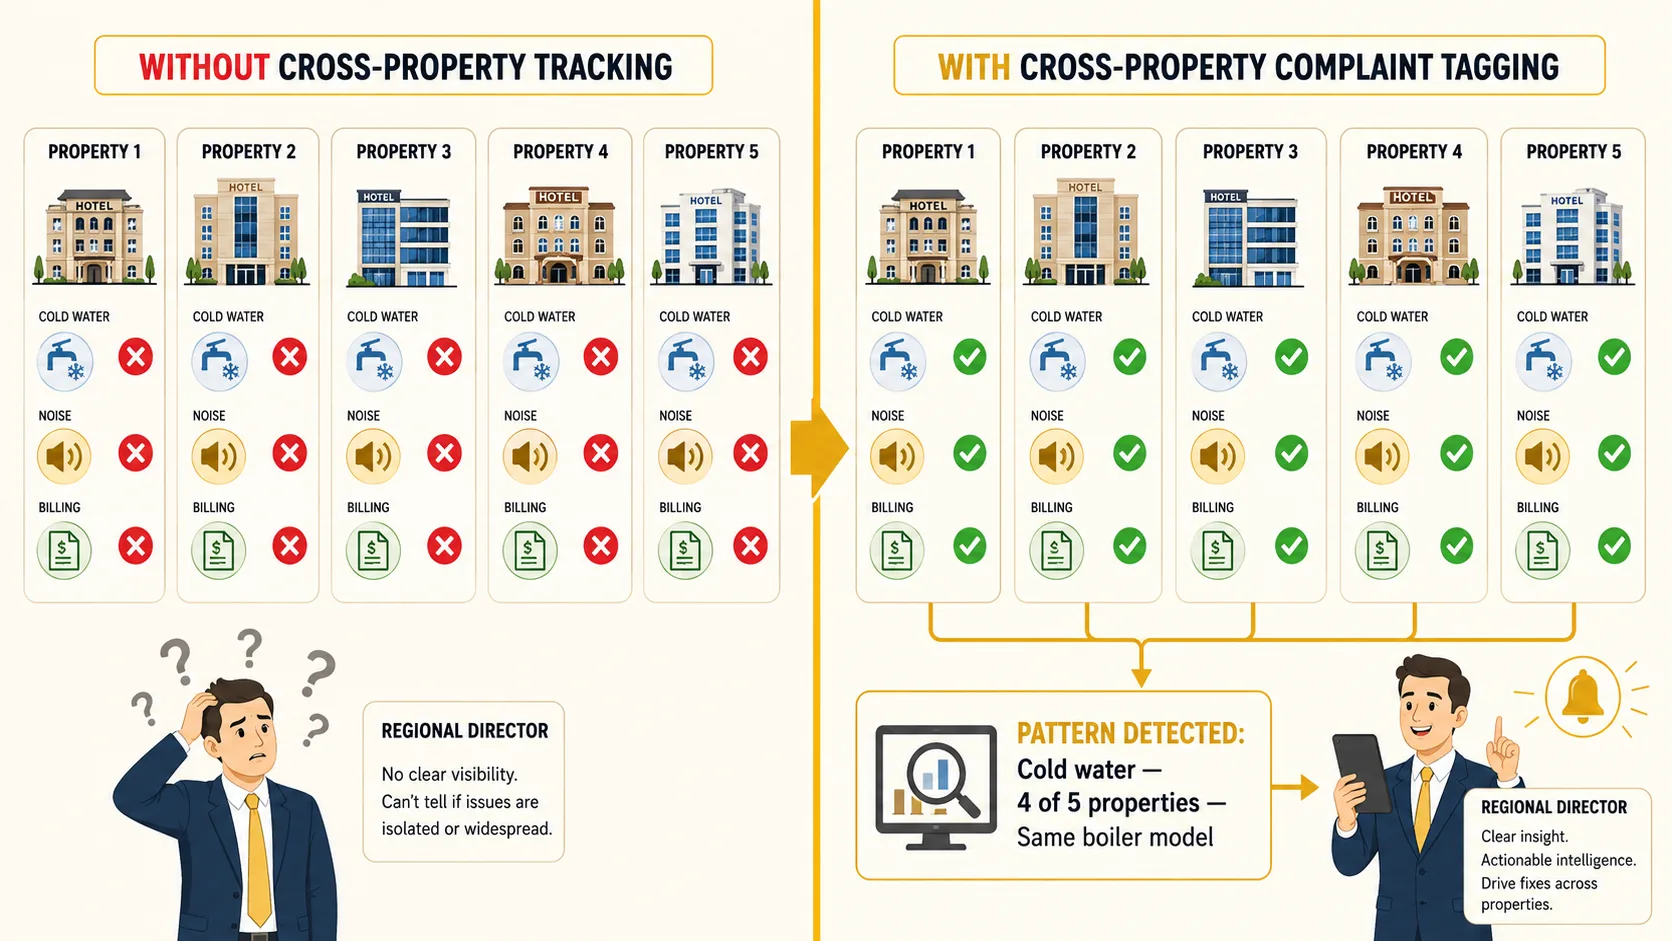
The tooling split is structural. PMS owns the transaction. CRM owns the survey. Complaint tracking owns the resolution workflow. None owns the pattern across properties. A hot water complaint at Property A and Property B look like two unrelated one-offs because no system in the mid-market hotel stack asks the question that would connect them. The data sits in three different categories of software. Zero of them query it across the portfolio.
What Complaint Blindness Actually Costs a Hotel Group
The obvious cost: $24,000 to $60,000 per year in guest compensation. Room comps, amenity credits, and loyalty point dumps run $2,000 to $5,000 per month for a 10-property group. Money spent apologizing for problems that were already logged at another property. The Regional Director approves each comp individually. The pattern connecting them is invisible. Every comp looks like an isolated incident. The budget line item grows. Nobody questions whether the same root cause generated half the comps because nobody can see that half the comps share a root cause. This is the same financial blind spot that costs hotel groups 2 to 3 percent in missed revenue every week from delayed pricing decisions. Different data. Same structural gap. The cost is visible only after it is spent.
The hidden cost: OTA ranking degradation of 8 to 15 percent. Booking.com and Expedia algorithms flag property groups with clustered complaint categories as systemic-risk operators. A pattern of similar facility complaints across properties drops visibility scores. For a 10-property group running 120 rooms per property at $135 ADR and 70 percent occupancy, that displacement costs $80,000 to $180,000 per year in bookings. Those bookings go to competitors with cleaner cross-property signals. The group never knows it lost them. OTA ranking is a relative metric. A drop of 8 percent means a competitor rose 8 percent. The competitor does not need to be better. They just need complaint data that does not cluster.
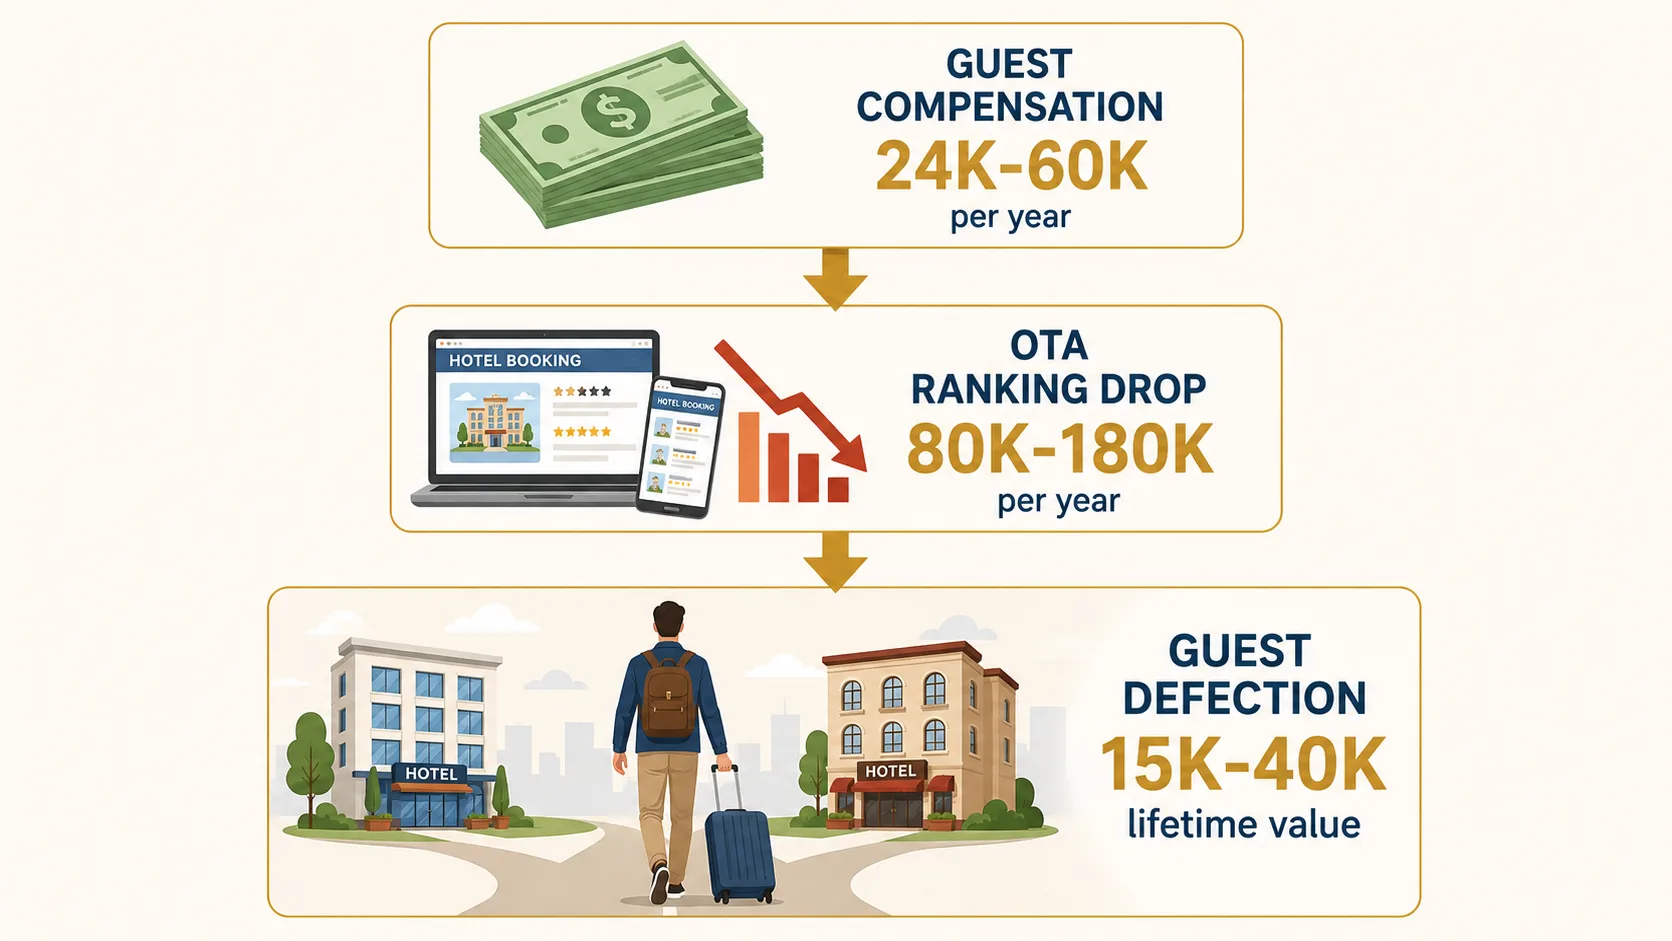
The compounding cost: repeat guest defection at $15,000 to $40,000 per traveler. A mid-tier business traveler spends $150 to $200 per night, 15 to 25 nights per year, for 3 to 5 years. When the same issue surfaces at two properties in the same portfolio, that guest stops booking the chain entirely. Complaint clusters map directly to defection patterns within 18 months. The group never sees the connection because defection is tracked per property. A guest who stopped booking the downtown property and the airport property shows up as two separate churn events. They were one guest who hit the same problem at two locations. The system counted the bookings lost. It never counted the reason.
Why the Mid-Market Accepts Complaint Blindness
Hotel groups accept complaint resolution as a per-property cost of doing business because the mid-market has no tool that aggregates operational complaint data across locations. Enterprise chains with 200-plus properties run dedicated quality assurance teams with custom data warehouses. They can afford to build cross-property complaint visibility. Mid-market groups with 5 to 30 properties have the same problem but cannot justify a QA analytics hire, let alone a data warehouse. The result: they operate at enterprise-scale complexity with property-scale tools.
The gap is not budget. It is category. No tool in the mid-market hotel stack does cross-property complaint categorization by root cause type. PMS vendors do not build it because enterprise chains build their own. CRM vendors do not build it because their architecture is survey-to-sentiment, not incident-to-root-cause. Complaint management tools track resolution. They do not detect cross-property recurrence. Three categories of software. Zero that ask the question that would connect a cold water complaint at Property A to a cold water complaint at Property C. This is the structural gap market-validated intelligence is built to close: a problem with measurable cost and zero tools priced for the operators who carry it.
The Regional Director who suspects the pattern exists but cannot prove it is not failing. Their tools are failing them. The data to answer the question exists. It sits in 12 PMS instances across 12 properties. It has never been queried as a group. The Regional Director feels the pattern intuitively. They hear about the same cold water complaint at three properties in three months. They make a mental note. The next operational fire pulls them away. The note disappears. Six weeks later, another property logs cold water. The cycle continues. The problem is not attention span or staffing. It is tooling that makes pattern detection a function of human memory. No amount of follow-up discipline compensates for a system that was never designed to surface the pattern.
What Changes When Complaint Data Connects Across Properties
Cross-property complaint tagging categorizes every complaint by root cause type at the moment it is logged. Facility. Housekeeping. Food and beverage. Billing. Noise. Each complaint gets a category tag that follows it across the portfolio. The system surfaces repeat patterns automatically. A group with 12 properties and 600-plus monthly complaints discovers that cold water complaints cluster in four properties built by the same contractor with the same boiler model. The fix is not 12 property-level work orders. It is one capital conversation with the regional facility manager. The multi-property intelligence system catches what individual property logs cannot.
Recurring complaints drop 50 to 65 percent within 90 days. Guest compensation costs fall 40 percent. OTA scores stabilize. And the business traveler who would have defected after the second bad stay never reaches defection. The second bad stay does not happen. The second bad stay was the same complaint as the first. Different property. Same root cause. Cross-property tagging caught it after the first occurrence and prevented the second.
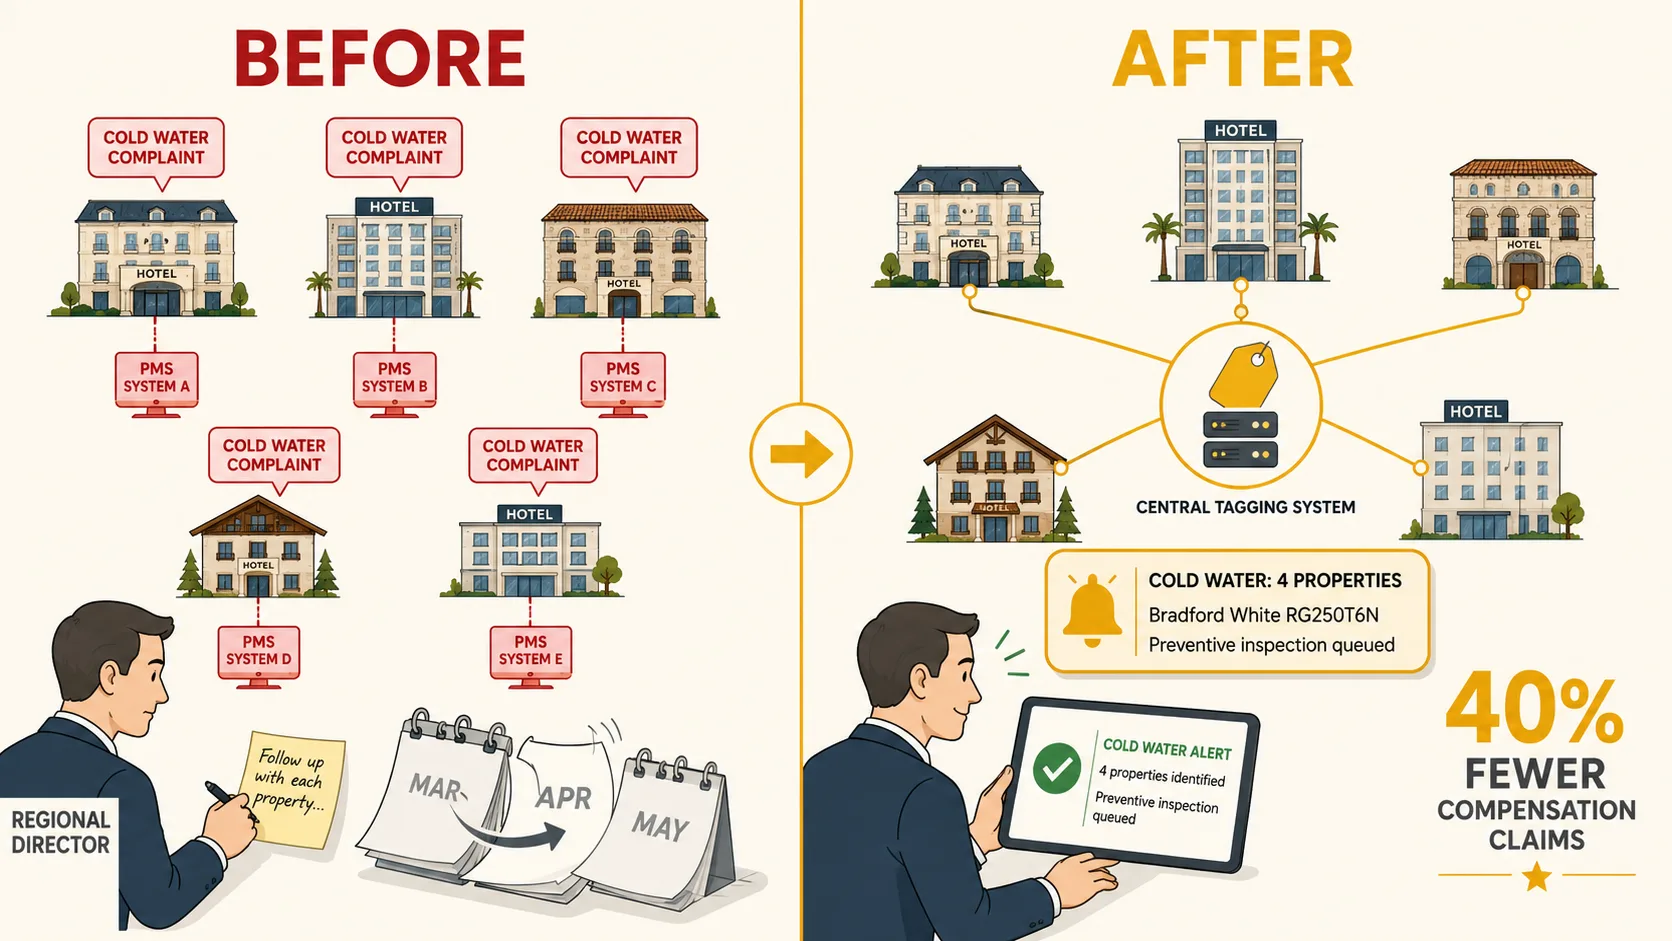
The Regional Director who used to hear about the cold water complaint at Property A and make a mental note now gets an alert. Cold water complaints detected at four properties. Same boiler model. Preventive inspection queued across all four locations. Estimated preventive cost: $1,800 per property. Estimated cost if deferred to the guest compensation cycle: $4,200 per property in comps plus OTA ranking impact. The data that used to live in separate PMS instances now surfaces as a single operational signal. The Regional Director stops relying on memory. The system remembers.
The cost of the fix is not a new PMS. Not a data warehouse. Not a QA analytics hire. It is a categorization system that sits on top of existing PMS instances and tags complaints as they are logged. No migration. No rip and replace. The PMS still manages reservations. The CRM still manages surveys. The complaint tagging system manages the one question the existing stack never asked: has this happened before, somewhere else, in this portfolio? The data was always there. It was just never queried as a group. This is the same intelligence principle behind cross-property operational visibility: connect data that already exists. The connections reveal what the isolated data cannot.
What to ask next
Common questions operators ask after reading this:
How do hotel groups track complaint patterns across multiple properties?
What does cross-property complaint data look like for mid-market hotels?
How much do repeat guest complaints cost a hotel group per year?
Can hotel PMS systems detect recurring problems across properties?
Related read: Complaints are not the only operational signal that gets lost between properties. The same HVAC compressor model fails at Properties 2, 4, and 6 while the Regional Director authorizes $10,150 emergency repairs that were predicted and preventable. Different department. Same structural gap. Single-property tools cannot see cross-property patterns.
Related read: The cross-property visibility gap compounds across every operational dimension. Regional Directors spend 4 hours every Monday morning compiling reports from systems that already contain the data. The problem is not data availability. It is that the data was never designed to be viewed together.
Related read: The same fragmented-system architecture that hides complaint patterns also blocks group sales. Hotel groups lose 6 to 12 bookings per year because no single screen shows portfolio-wide availability. PMS tracks rooms per building. Group RFP response needs the whole picture. The gap costs $90K to $960K in direct lost revenue, and $1M to $3M when the RFP pipeline evaporates.
See What Complaint Categories Repeat Across Your Portfolio
The diagnostic pulls 12 months of complaint logs across every property. It categorizes each complaint by root cause type and maps exactly which categories repeat, at which properties, and at what frequency. The output is not a recommendation. It is a number the current systems cannot produce: the total spent on guest compensation for complaints that had already occurred at another property in the same portfolio. No software to buy. No PMS migration. Just the math the existing complaint logs were never designed to calculate.
Related read: The same per-property data isolation that lets complaints repeat also hides the revenue lost when suite guests check into standard rooms at a sister property. Guest data exists in every PMS. It is never connected.
How TheiaOps builds cross-property intelligence for mid-market operators →