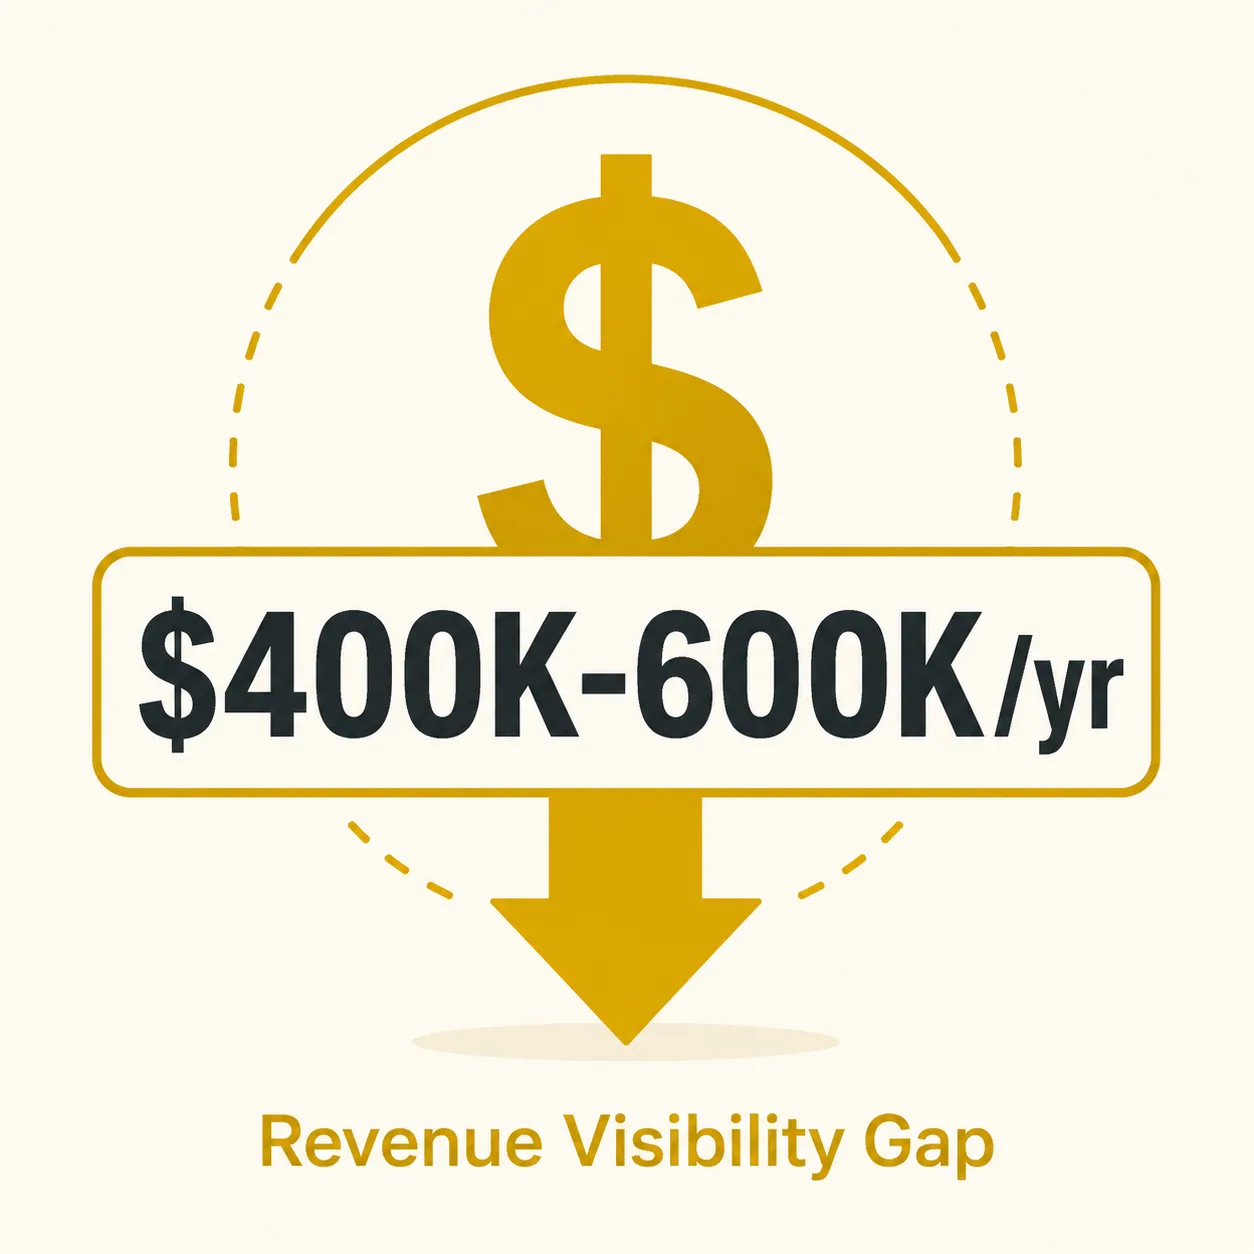
Waiting for weekly reports costs mid-market hotel groups 2 to 3 percent of revenue because the gap between transaction time and visibility time is measured in days, not minutes. By the time the report lands, the underpriced rooms and missed rate adjustments are already booked and gone.
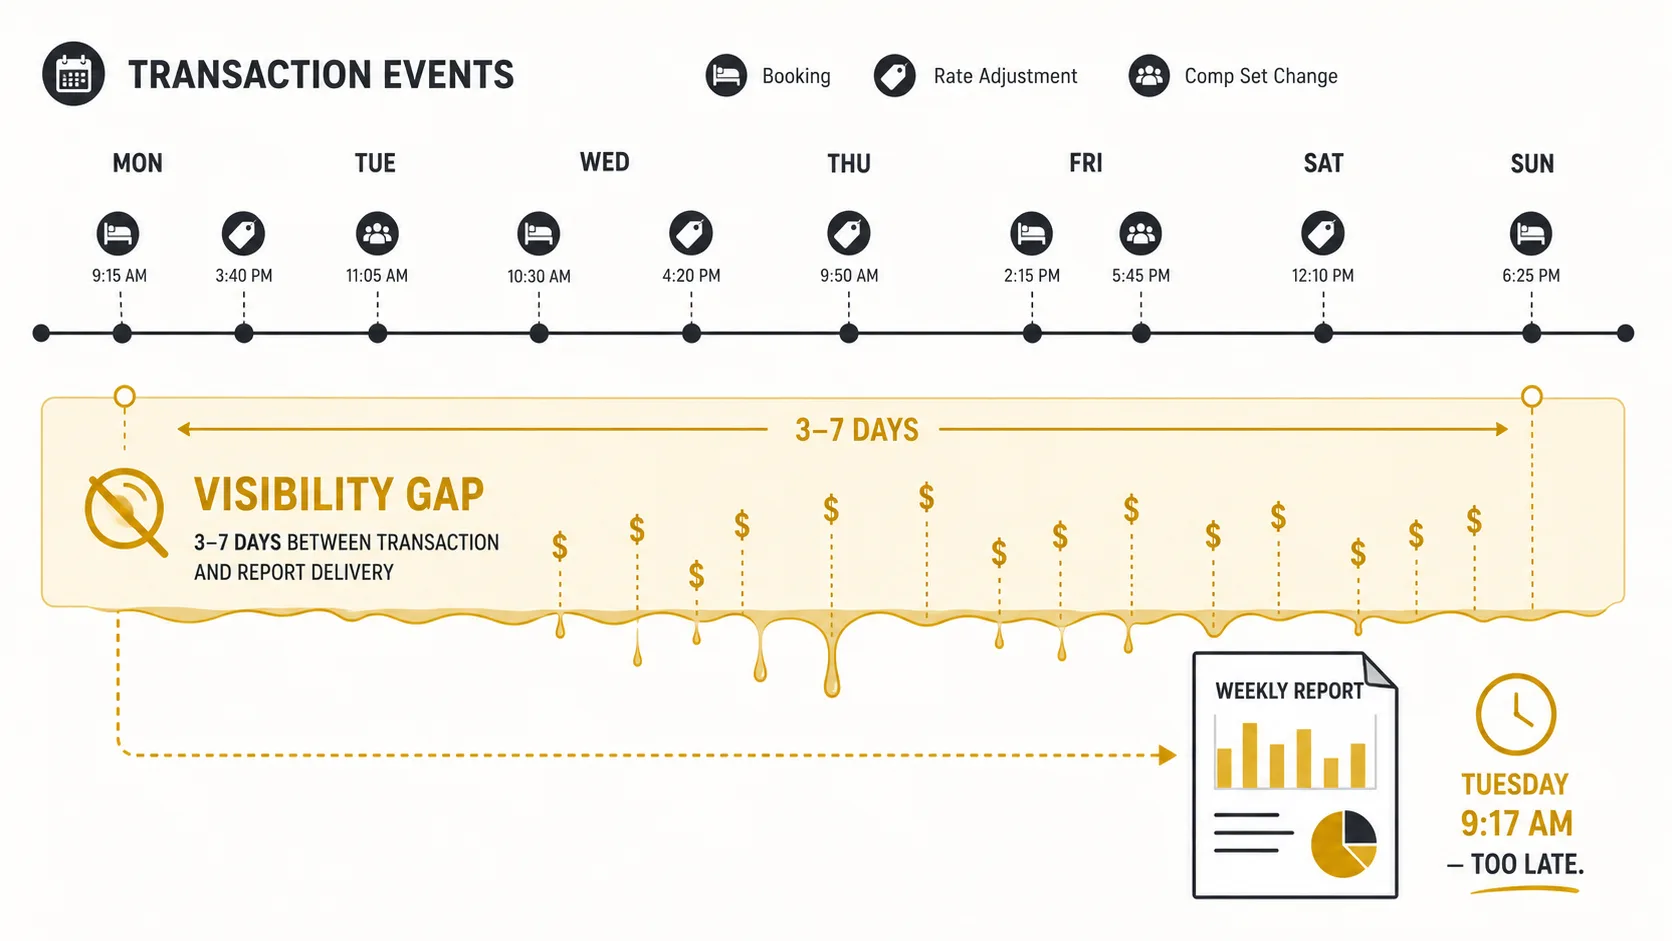
Tuesday, 9:17 AM. The weekly revenue report from six PMS instances lands. Saturday night shows three underpriced room categories across two properties. Sunday's group block should have triggered a rate adjustment. Nobody saw it. Monday was soft and nobody flagged it. Total bleed: $4,200. Next weekend is three days away with the same pricing rules still live. This is not a reporting failure. It is a structural gap between the moment money is booked and the moment anyone sees how much was left on the table.
Every Director of Operations overseeing 5 to 20 properties has opened a revenue report and found money that should have been captured. Not because anyone failed. Because the distance between transaction time and visibility time is measured in days, not minutes. By the time the report arrives, rooms have sold, rates are history, and the pricing decisions for next weekend are already set.
PMS Systems Record Bookings. They Never Learned to Compare Prices.
Property Management Systems (Opera, Maestro, RoomKey, Cloudbeds) are transaction ledgers. They record reservations, track room inventory, generate folios. They do those jobs well. They were never architected to answer the question a multi-property operator actually needs answered: "Across all 12 properties, which rooms sold below competitive rate last night?"
The data exists. Every PMS captures booking date, room category, rate code, occupancy. It is all there, separated across a dozen databases, each with its own schema, its own rate plan structure, its own definition of a "weekend." The information the operator needs to price next weekend's rooms is trapped. Not missing. Trapped behind system boundaries that were never designed to be crossed.
This is the gap multi-property intelligence closes: reading across PMS instances without replacing any of them. The PMS answers "what happened." It never answered "what is happening right now across the portfolio." That question requires data from six systems moving through one lens. Nobody designed that lens. The mid-market has been assembling it in Excel every Monday morning instead.
The same structural gap causes the four-hour Monday report. Different symptom, same root cause. Systems architected for single-property transactions cannot surface cross-property patterns. The spreadsheet is not a solution. It is the scar tissue where the missing tool should be.
What the Visibility Gap Actually Costs
The obvious cost is the pricing blind spot. A 10-property group averaging $2 million annual revenue per property, bleeding 2% to 3% on suboptimal weekend pricing alone, loses $400,000 to $600,000 per year in revenue the properties already earned. The guests booked. The rooms were occupied. The operator simply did not charge enough because the operator did not know what comparable rooms were selling for at adjacent properties until after the weekend ended.
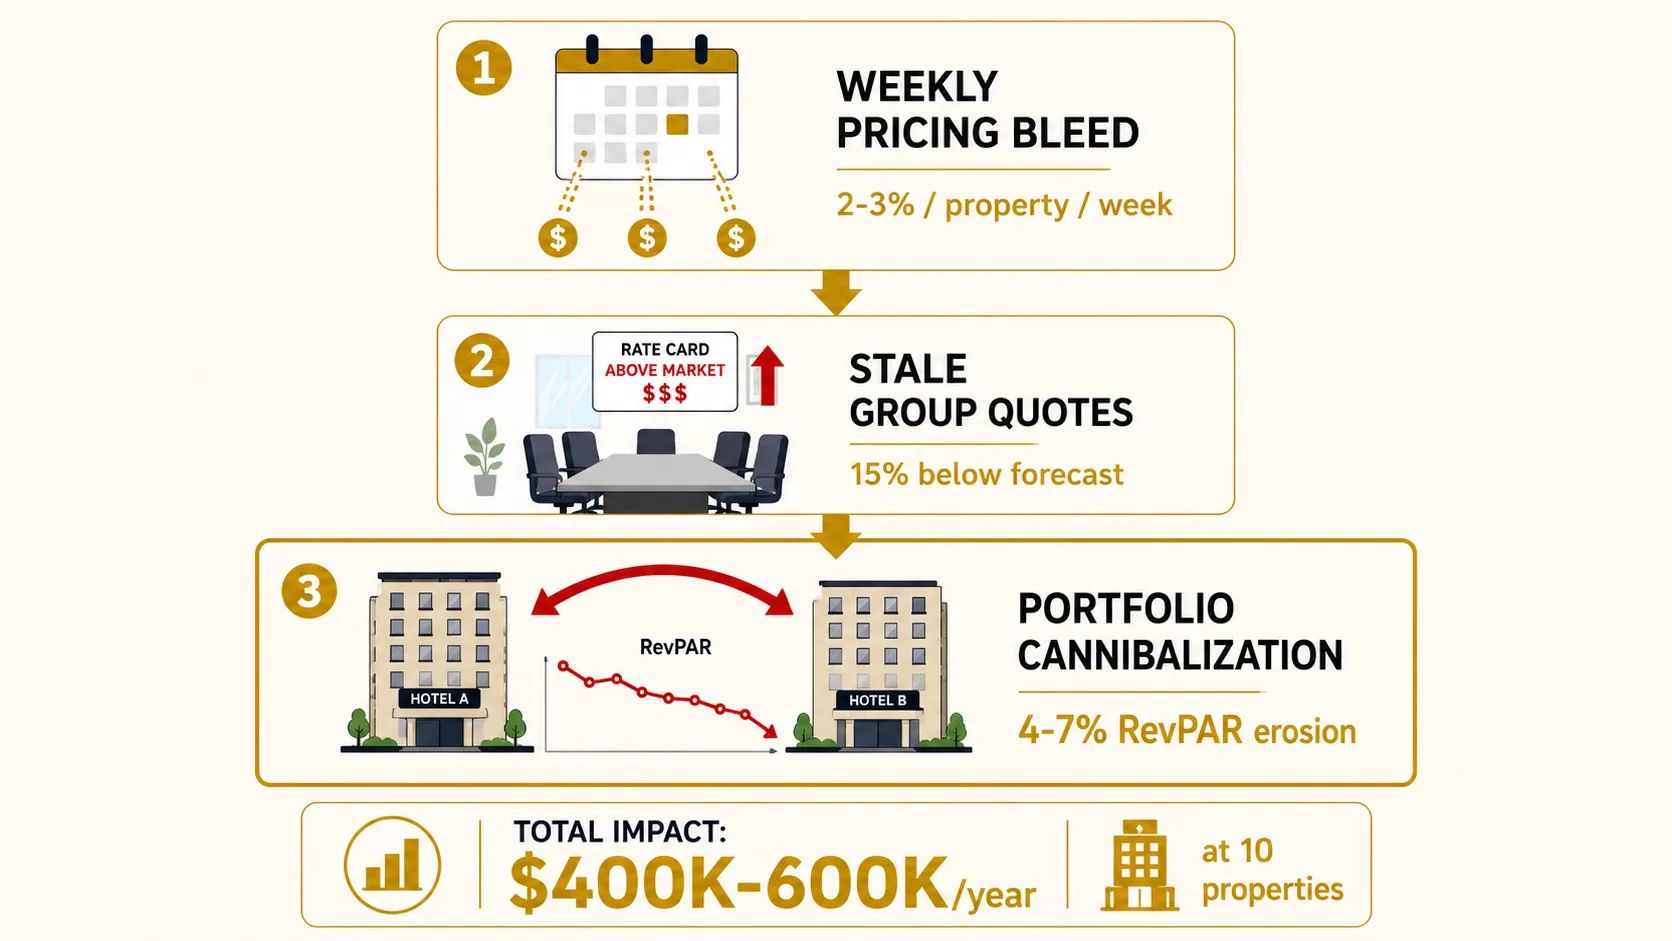
The hidden cost lands in group sales. A corporate group requests 40 rooms for a midweek conference. The sales manager quotes rates based on last week's occupancy report. This week is trending 15% above forecast. Compression nights sold at base rate. Negotiated corporate rates honored on dates that should have been blacked out. Every quote built on stale data is a discount the market did not need. The group pays exactly what was asked. The hotel leaves the difference on the table.
Then the compounding cost: multi-property cannibalization. Property A drops OTA rates to fill soft dates, unknowingly pulling demand from Property B three blocks away. Neither operator sees the cross-property pattern. The OTAs are happy to take commission on both bookings. Portfolio-wide RevPAR drops 4% to 7% without any single property report showing a problem. Brand erosion follows. Guests learn to book the cheaper sister property for the same experience. The owner pays for the cannibalization. The PMS reports every booking as a win.
Why Mid-Market Hotel Groups Accept This
The alternatives have not fit, so the Monday autopsy ritual survives. Not because it works. Because nothing else was priced or architected for 5-to-20-property operators.
Enterprise revenue management systems like IDeaS and Duetto deliver real-time pricing intelligence across portfolios. They also cost $500 to $1,500 per property per month. The breakeven for that investment sits around 50 properties. A management company running 8 hotels is not spending $48,000 to $144,000 per year on a tool that requires a dedicated revenue manager to operate. The math does not close. So the industry normalized the gap as "how multi-property hospitality works." Monday morning spreadsheets are not a solution. They are a surrender to the tooling gap between single-property PMS and enterprise RMS.
On the other end: single-property benchmarking tools and STR reports. They provide comp set data and market positioning. What they cannot do is aggregate live rate data across your own properties in real time. They tell the operator how the market performed last month. They do not tell the operator that Property 4 is underpricing its suites right now, today, while the rooms are still bookable. External benchmarks describe the past. Internal visibility catches the present. The mid-market has plenty of the first and none of the second.
So the gap persists. Three to seven days between booking and awareness. Pricing decisions made on last week's numbers. Revenue left on the table that no single-property report can detect. The industry accepts this not because operators are careless. Because nobody built the tool that closes the gap at the scale where mid-market groups actually operate.
What Changes When Visibility Collapses From Seven Days to Under 24 Hours
A cross-property revenue snapshot arrives by 7 AM. Not a spreadsheet. Not six CSV exports. One view. Every property's occupancy, ADR, RevPAR normalized regardless of which PMS each property runs. Property 4 flagged: weekend suite rates $38 below the portfolio median for comparable rooms. The anomaly surfaced while the rooms were still bookable. The Regional Director adjusts the rate at 8:15 AM. By Friday check-in, those suites sold $4,800 higher than they would have under the old pricing rules. Not by adding staff. Not by buying an RMS. By closing the gap between when money is booked and when someone can see whether it was booked at the right price.
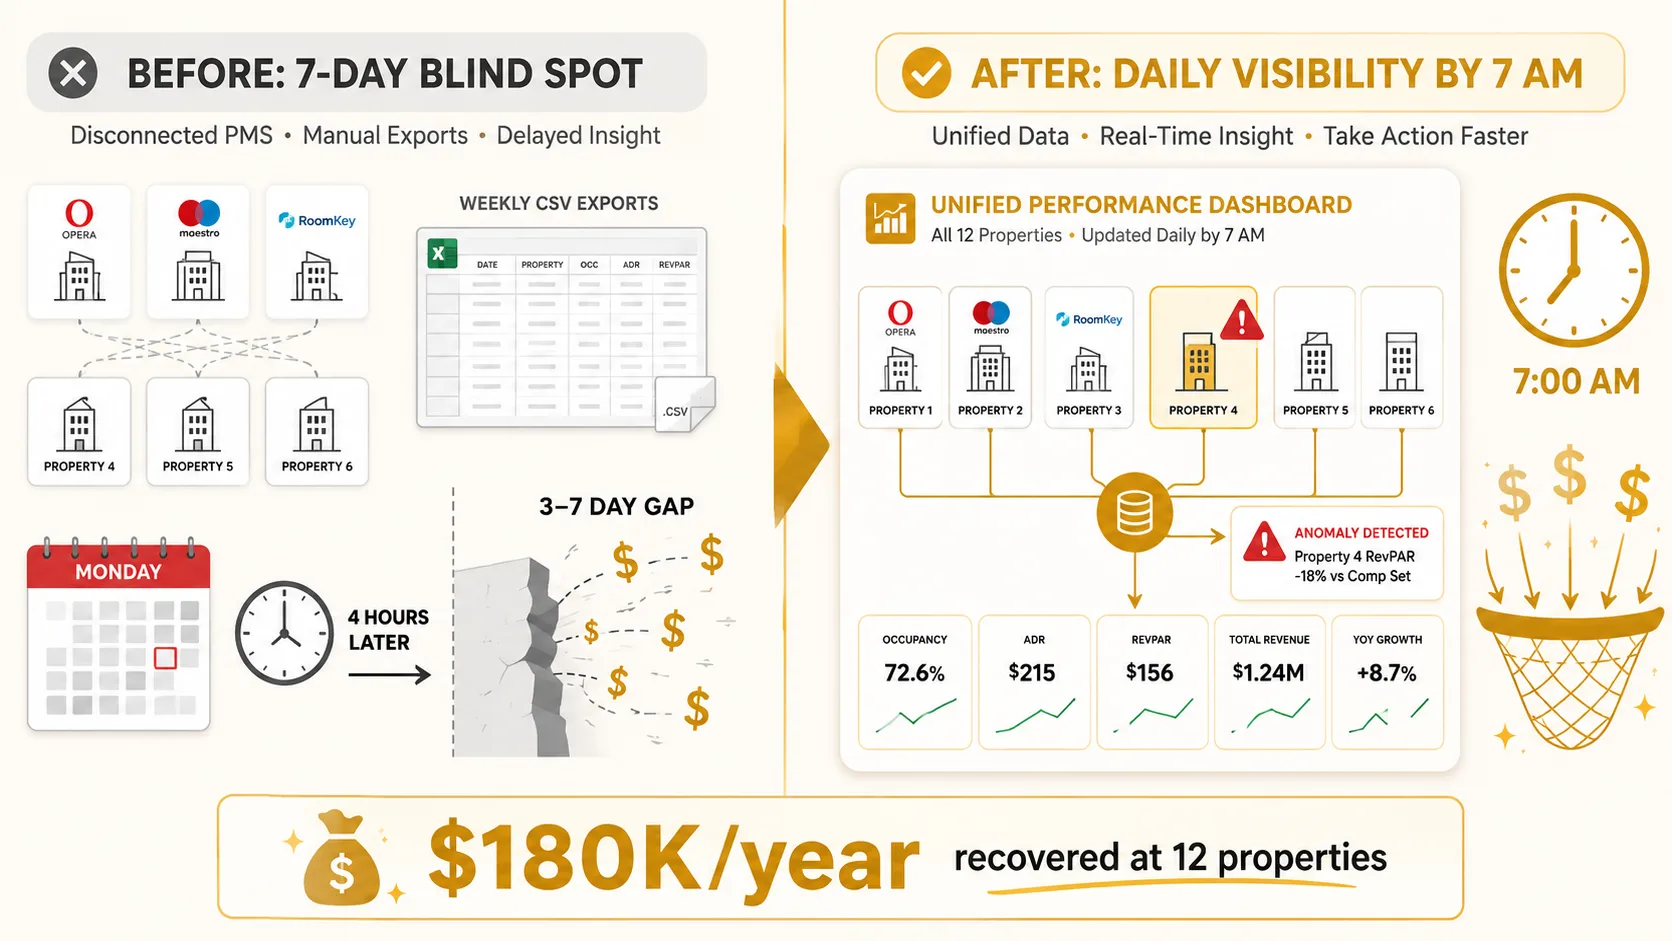
A 12-property group recovering $180,000 per year by collapsing the pricing feedback loop from seven days to under 24 hours. Same properties. Same staff. Same PMSs. One difference: the data from six systems moved through one lens while the rooms were still for sale.
Revenue meetings shift. Instead of "here is what we lost last weekend," the conversation becomes "here is what we caught last night and corrected." The spreadsheet does not become automated. It becomes unnecessary. The question it was answering (what happened last week) is replaced by a question the operator could not ask before: what is happening right now. And it all sits on top of existing PMSs. No rip-and-replace. No new login for staff. Just the cross-property lens the systems were never designed to provide.
What to ask next
Common questions operators ask after reading this:
What causes revenue leakage in multi-property hotel groups?
How much does a 7-day hotel reporting lag actually cost?
Why do PMS systems fail to prevent underpriced hotel rooms across a portfolio?
What is the pricing blind spot in hotel revenue management for groups under 20 properties?
Related read: The same structural gap between what PMSs track and what operators need to see shows up every Monday morning. Four hours of copy-paste that the systems were never designed to eliminate.
Related read: Revenue isn't the only thing leaking across properties — the housekeeping idle/burnout split burns $78,000 to $89,000 per year at 5-property groups while the morning huddle arrives three hours late.
If This Sounds Like Your Revenue Meeting
We analyze multi-property hotel operations to measure the revenue visibility gap your systems can't see. It starts with a diagnostic. We quantify how many revenue-hours elapse between transaction and awareness across your portfolio, and what that number looks like annualized. No pitch. Just numbers.