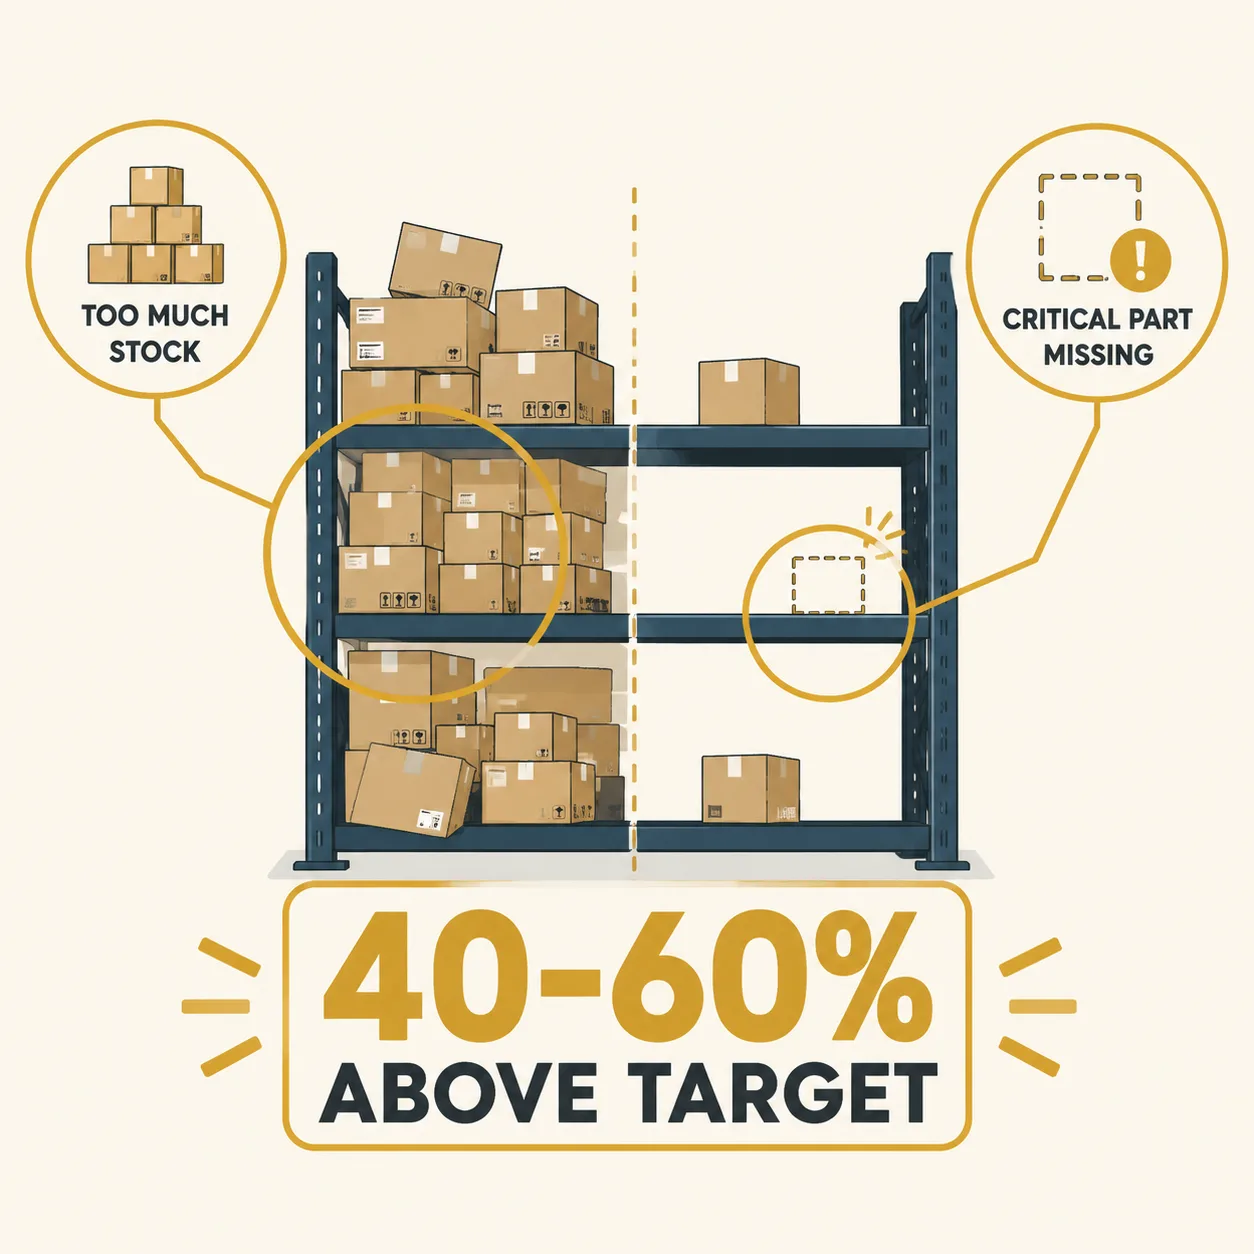
MRO inventory stays above target while the ERP says lean because the system counts units, not consequences. The stockroom has twenty-three types of bearings, just not the one that stopped production, and the ERP cannot tell critical parts from convenient ones.
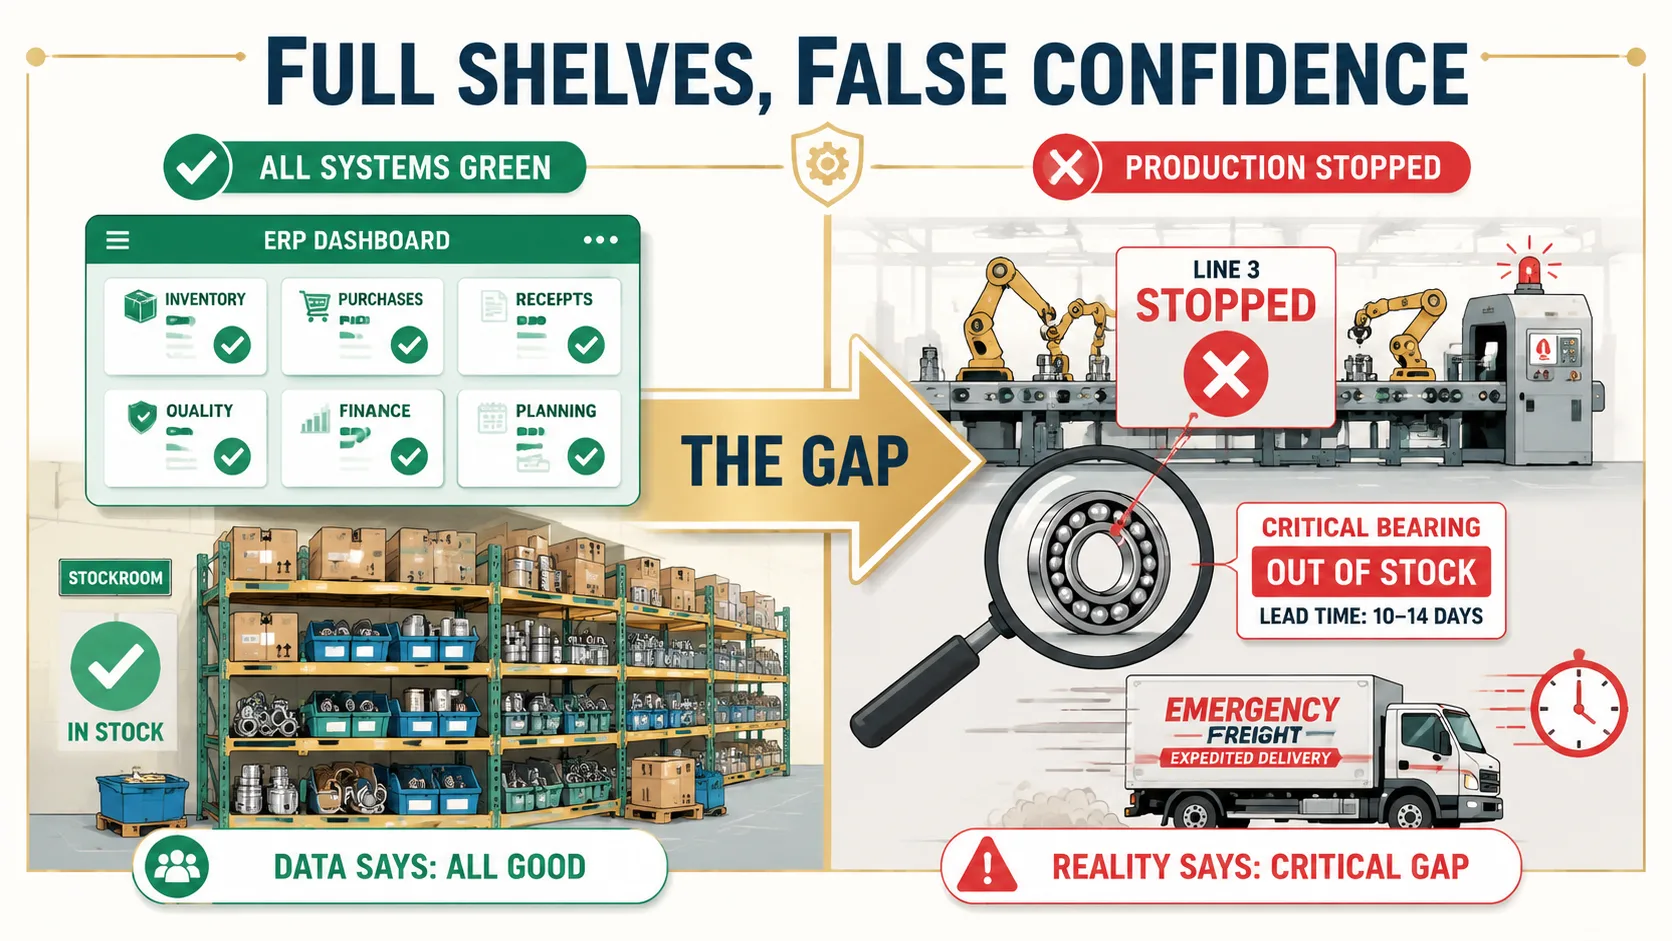
The maintenance manager walks the stockroom floor. Shelves are packed. The ERP screen glows green across all 1,200 SKUs. And yet the plant manager just authorized $80,000 in emergency freight. A main drive bearing failed on Line 3. A bearing the ERP said was in stock. The stockroom had bearings. Twenty-three types. Just not the one that stopped production. This is the ritual MRO operators live inside: full shelves, false confidence, and a purchasing process that cannot tell critical from convenient.
Every maintenance manager overseeing 500 to 3,000 spare parts has opened a stockroom report and found a gap between what the system says is there and what is actually available to keep the plant running. Not because the system is broken. Because the system counts units. It does not know which units matter when the consequence of being wrong is a stopped production line.
ERP Reorder Logic Treats Every Part Identically
ERP reorder modules apply one formula: reorder point, safety stock, lead time. Part #4472 gets the same treatment as Part #8821. The first is a main drive bearing. Production stops without it. The second is a standard hex bolt. Three local suppliers stock it. Next-day delivery. $0.40 each. The ERP cannot tell the difference between a $200 bearing that stops a $2 million per day production line and a bolt any Fastenal stocks by the bin.
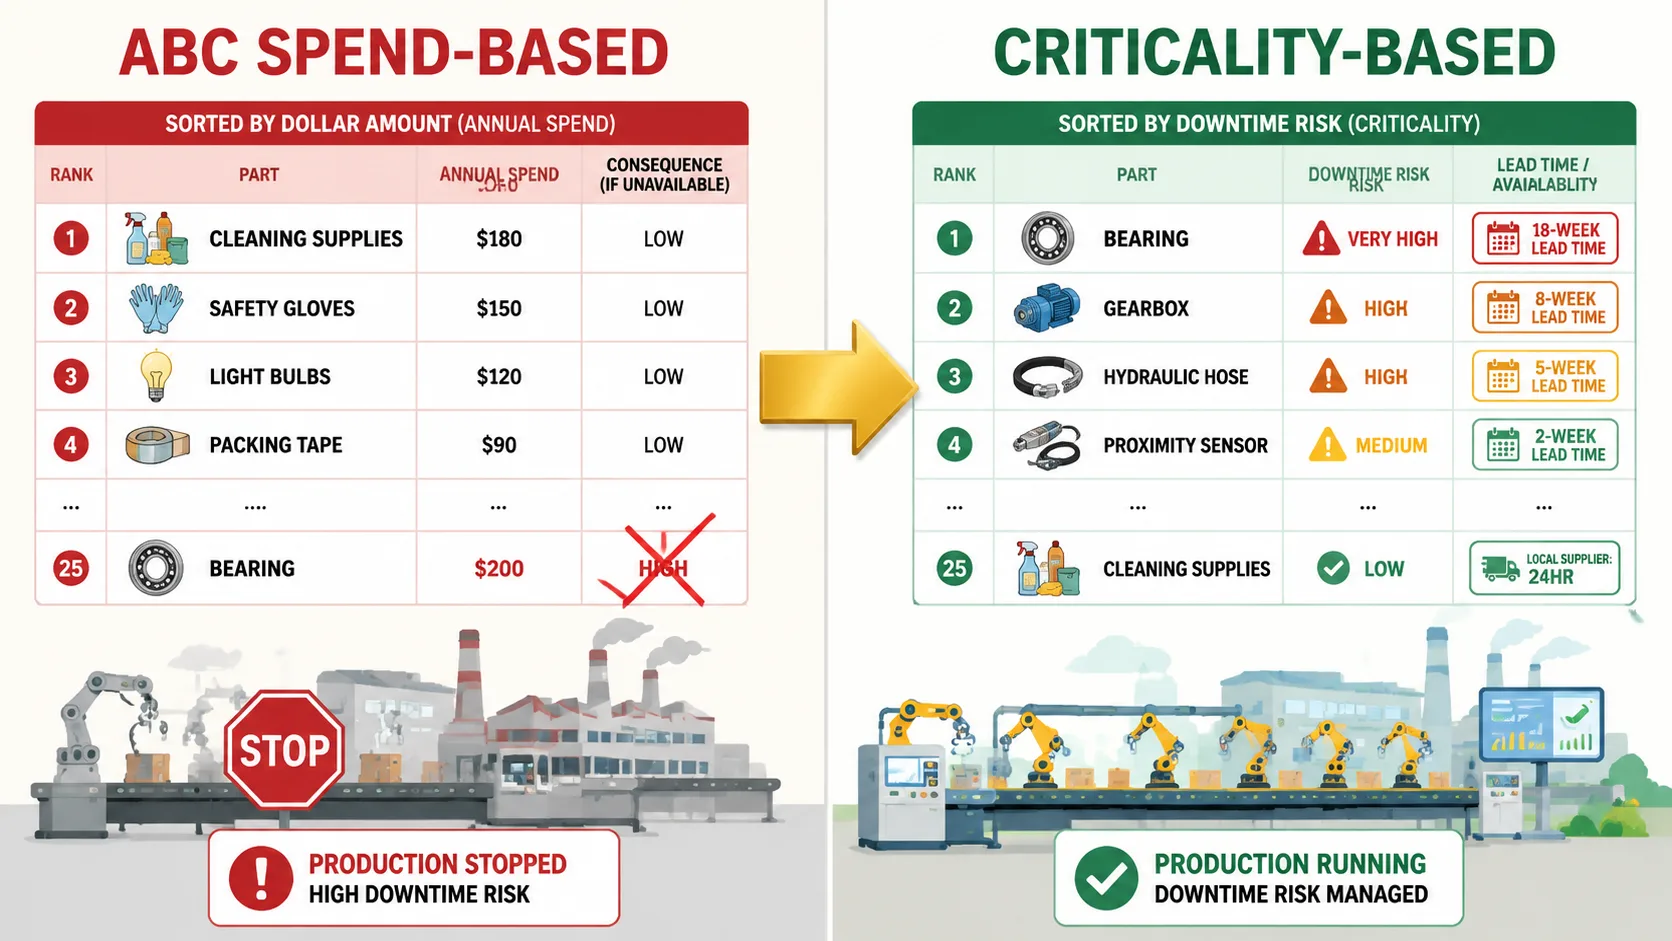
This is not a configuration error. ERP reorder logic uses consumption history multiplied by fixed lead time. It has no concept of downtime consequence. No awareness of supplier reliability variance. No mechanism for part criticality tiers. ABC analysis sorts by spend. It is the only classification tool most MRO operators have. And it measures the wrong thing. A $200 bearing with an 18-week lead time and line-stopping consequence looks unremarkable on any spend report. A shelf of cleaning supplies at $180 consumes more annual procurement budget and gets flagged as high priority. The system is blind to consequence.
The same structural gap causes stockouts that ERPs fail to predict. In both cases the system sees a unit count. It never sees the forces acting on that unit. Demand velocity on one side. Downtime consequence on the other. Same architecture. Two failure modes. The maintenance manager pays for both.
What Overstocking MRO Parts Actually Costs
The obvious number is the inventory itself. MRO operations consistently run 40 to 60 percent above target stock levels. At a mid-size plant managing 800 to 1,200 SKUs with $1.2 million to $3 million in spare parts, annual carrying costs run 25 to 30 percent. That covers warehousing, insurance, obsolescence, and the capital itself. It adds up to $300,000 to $900,000 per year in holding cost. Spent on parts that sit. Not because the plant needs them. Because nobody can prove which ones it does not need.
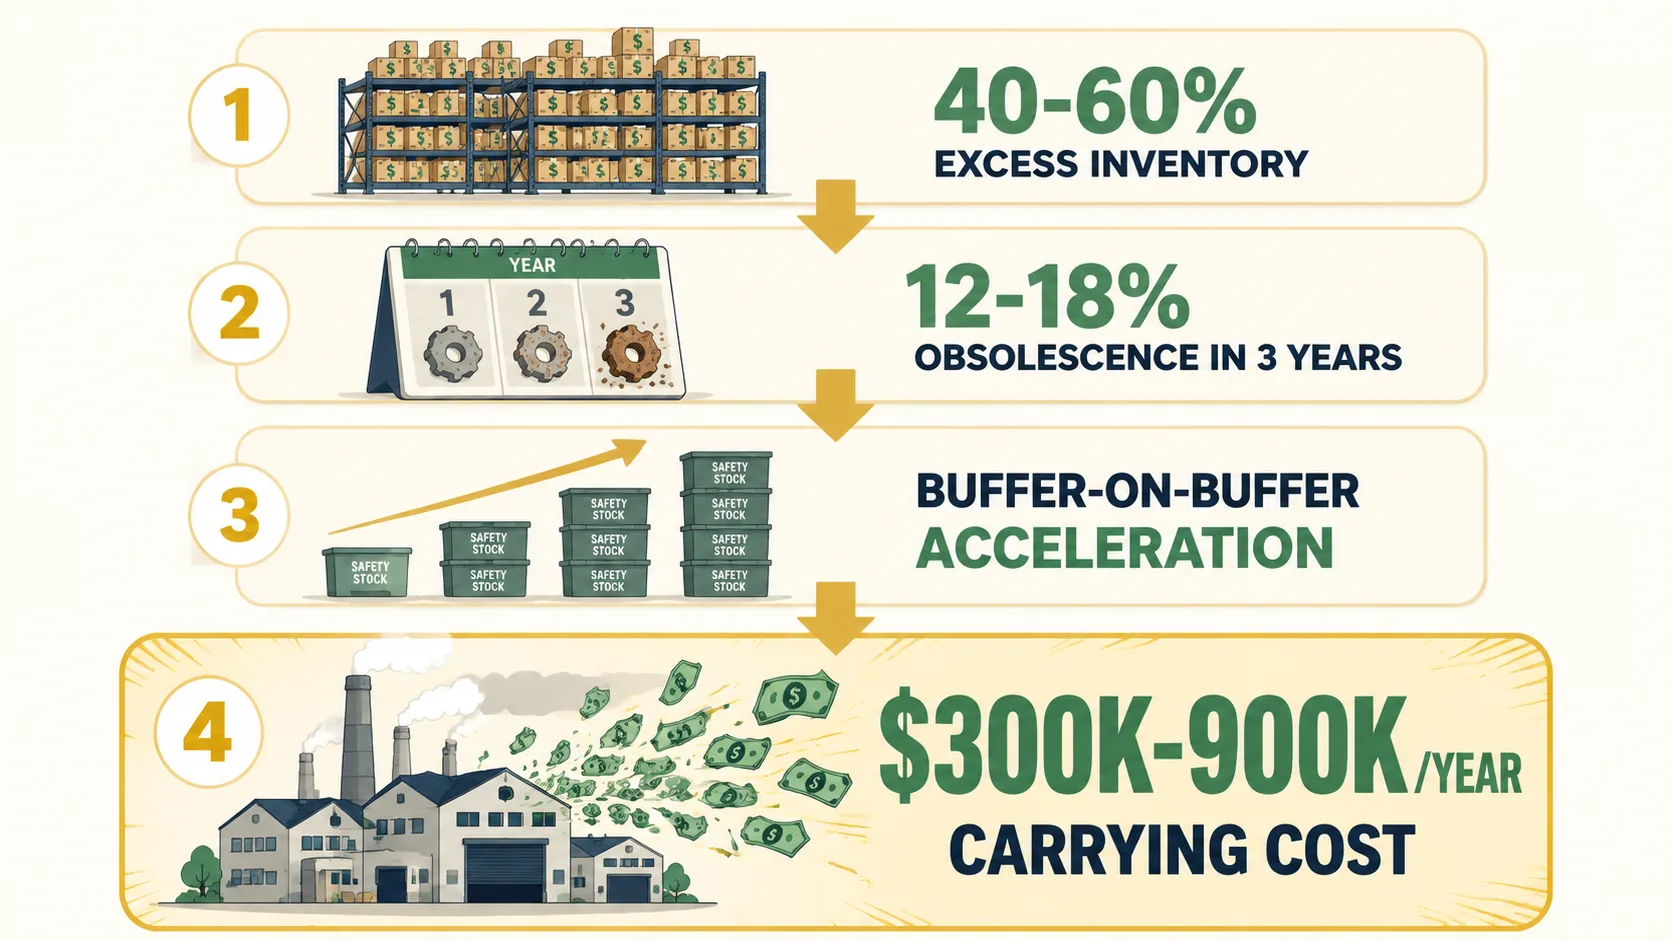
The hidden cost is obsolescence. Equipment gets upgraded. Processes change. Parts that were critical three years ago sit untouched while their replacements arrive and get stocked alongside them. Industry data shows 12 to 18 percent of an MRO stockroom goes dead within three years. Nobody removes the old parts. The system treats every SKU as equally valid. The stockroom grows. The carrying cost grows with it.
Then there is the compounding cost. Quarterly safety stock reviews add buffer on top of buffer. Nobody can prove which parts are already double-covered. The maintenance manager cannot demonstrate that SKU #4472 is stocked three times over while SKU #8821, the critical bearing with an 18-week lead time, sits at minimum. The ERP does not surface the comparison. The bloat accelerates. Forty percent over target this year becomes 52 percent next year. Meanwhile the one bearing that stops Line 3 is still not stocked deep enough. The ERP spread the reorder budget across 900 low-consequence parts.
The expedited freight on understocked criticals layers on top. Emergency shipping from secondary suppliers. Premium charges. Production downtime at $50,000 to $200,000 per hour while a bearing crosses the country on a truck. The maintenance department pays for the overstock and the stockout at the same time. The ERP reports both as "inventory within parameters."
Why Mid-Market MRO Operators Accept This
The alternatives have not fit. The "stock everything deep" strategy survives not because it works but because nothing else was priced or architected for the mid-market MRO operator.
CMMS systems track maintenance schedules and work orders. Maximo. Fiix. MaintainX. They tell the maintenance team what to repair and when. They do not drive inventory intelligence. A CMMS knows the mean time between failure for a pump. It does not know whether the replacement seal for that pump is stocked deep enough to survive a 14-week supplier lead time.
Enterprise supply chain suites model demand variability, lead time uncertainty, and part criticality. SAP IBP. Oracle SCM. They also require a backbone implementation that runs 12 to 18 months and breaks even at 50,000-plus SKUs. A mid-market MRO operator with 200 to 2,000 employees and 500 to 3,000 spare parts is not running SAP IBP. The math does not close.
The mid-market MRO operator lives in a tool gap. Two choices. ERP reorder points that overstock everything. Or spreadsheets that somebody built in 2018 and has not updated since. Neither can answer the question that actually matters: which 5 percent of parts will stop production, and which 85 percent can run lean? So the industry accepts the bloat as the cost of uptime. Full shelves feel like insurance. Nobody gets fired for having too many bolts. Everyone gets fired when Line 3 stops. The rational self-interested decision is overstock. The ERP provides zero counter-evidence. This is exactly the gap market-validated intelligence is built to close. Entering a category only after proving the pain is real, the cost is measurable, and existing tools are not solving it.
What Changes When Parts Are Classified by Consequence, Not Spend
Now imagine a different stockroom review. Parts classification shifts from spend-based ABC to downtime-risk-based criticality scoring. The system knows lead time variability per supplier. Not the catalog number. The real one. It knows which parts have 18-week lead times and no alternate source. It knows which ones can be sourced from three local suppliers in 24 hours. It knows the difference between a bearing that stops a production line and a bolt that does not.
Within 90 days: identification of the 8 to 15 percent of SKUs where overstock is deepest. And the 3 to 5 percent where understock risk is real. The plant manager sees both lists and reallocates. Capital shifts from low-consequence bulk to high-consequence criticals.
Within six months: inventory levels drop 20 to 30 percent without increasing stockout frequency. Not because purchasing negotiated harder. Not because anyone reduced consumption. Because the reduction pulled from the 85 percent of parts that never should have been deep-stocked. The capital shifted to the bearings and seals that actually stop lines.
One mid-size food processing plant: 1,100 MRO SKUs, $1.8 million in spare parts, carrying cost running $540,000 per year. After criticality-based rebalancing, inventory dropped to $1.26 million. Carrying cost fell $160,000 annually. Stockout-related downtime hours dropped 40 percent. Same ERP. Same suppliers. Same maintenance team. One difference: parts classified by consequence, not purchase price. The ERP still tracks what is on the shelf. The inventory intelligence layer tracks which parts can stop the plant and which ones just take up shelf space.
The outcome is not "better analytics." It is capital recovered from shelves where it was doing nothing. Redirected to the parts that keep lines running. The maintenance manager measured on conflicting metrics finally has a system that optimizes both. Uptime and cost control. Not one at the expense of the other. The spreadsheet becomes unnecessary. The quarterly buffer-on-buffer ritual stops. And it all sits on top of existing ERP infrastructure. No rip-and-replace.
What to ask next
Common questions maintenance and procurement managers ask after reading this:
How do I classify MRO parts by downtime risk instead of purchase spend?
What percentage of MRO inventory becomes obsolete within 3 years of equipment changes?
Why does ABC analysis systematically fail for maintenance spare parts classification?
How much does overstocking MRO parts actually cost per SKU in carrying cost?
Related read: The same ERP architecture gap causes stockouts at the other end of the inventory spectrum. When demand velocity outruns fixed reorder thresholds, stockouts cost distributors $40-80K in expedited shipping and 4-7x annual margin in lost accounts.
Related read: Batch-cycle blind spots are most visible at the quoting desk, not the stockroom. Building suppliers lose 8-15% of quotes to inventory that moved between the midnight batch cycle and the morning phone call. The ERP says 247 units. The yard has 11. Same ERP architecture. Different failure mode.
If This Sounds Like Your Stockroom
We analyze MRO inventory to find the overstock waste and understock risk ERP systems cannot see. It starts with a diagnostic. A downtime-risk map of the parts list across all suppliers, all lead times, all failure modes. Which 5 percent of SKUs can stop production? Which 85 percent can run lean? The answers exist in purchase history and consumption data. The ERP just never asked the question. No pitch. Just numbers.