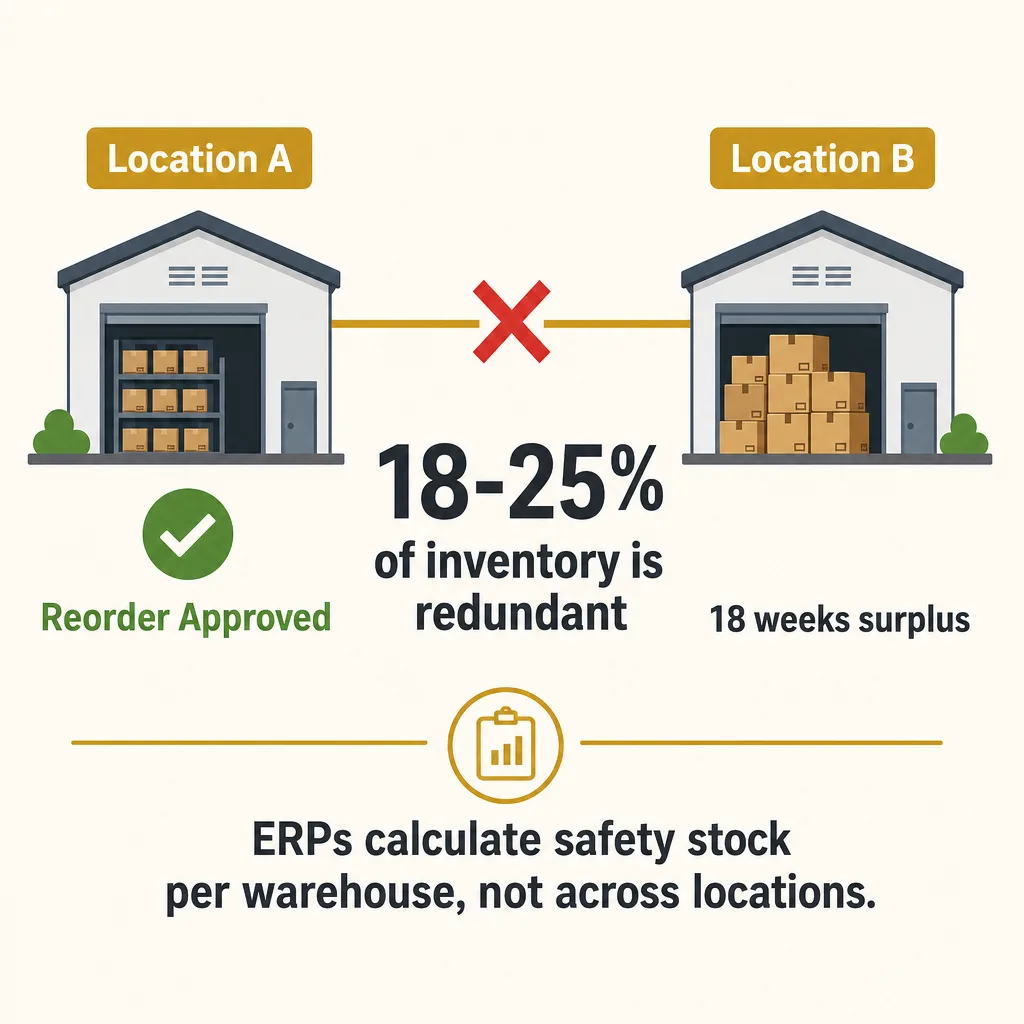
Multi-location suppliers buy inventory they already own because the ERP runs reorder logic per warehouse and never checks whether another location holds the same SKU. Location A hits its minimum threshold and orders $12,000 of surgical kits while Location B sits on 18 weeks of the identical product.
The purchasing manager at a three-location medical supply distributor places a $12,000 replenishment order for surgical kits. Across town, the second warehouse has 18 weeks of supply of the exact same SKU. It has been untouched for two quarters. The ERP approved both transactions. The reorder fired because Location A hit the minimum threshold. The surplus built because Location B's demand forecast runs independently. Same company. Same ERP instance. Two completely separate inventory realities. Nobody made a mistake. The system was never designed to ask whether Location B already owned what Location A was about to buy.
Why ERP Multi-Warehouse Modules Do Not Prevent Redundant Purchasing
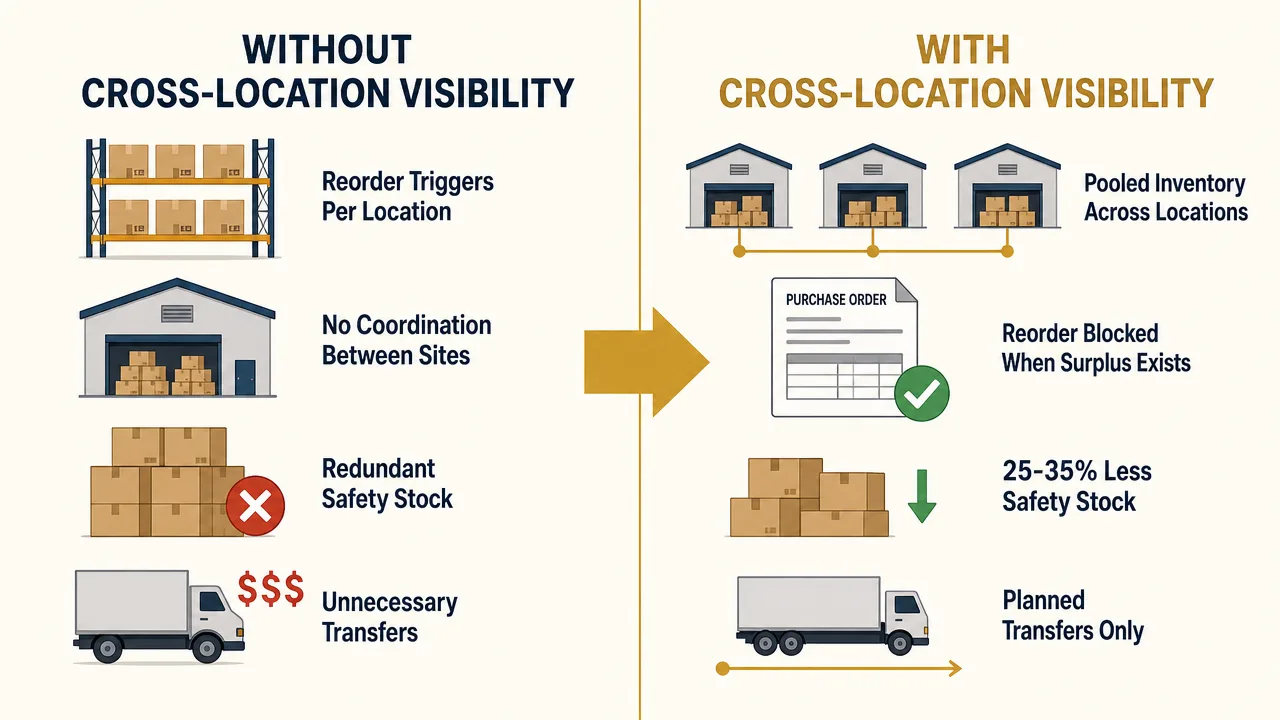
ERPs like NetSuite, Microsoft Dynamics, and Sage treat each warehouse as an independent inventory entity. The warehouse module was built for single-location manufacturers. When these vendors added multi-warehouse, they added a reporting view, not a coordination tool. The system displays what is where. It does not stop a reorder at Location A when Location B sits on excess. The reorder logic fires per location. Safety stock calculates per location. Demand forecasting models each location in isolation.
No ERP module correlates demand patterns across locations to flag that the seasonal surgical kit spike at Location A matches the seasonal dip at Location B. Same hospital system. Different buying departments. The ERP sees two unrelated demand curves. It cannot detect that Location B's surplus is Location A's buffer. The architecture was never asked to. Multi-warehouse was sold as a feature. What shipped was a view. Not a decision engine.
The workaround is inter-warehouse transfers. A manager notices Location B has excess. A phone call. A manual transfer order. The inventory moves. The reorder that should never have been placed already shipped. The transfer becomes a cost of doing business. The purchasing team does not see it as a process failure because the process was never designed to prevent it. The ERP reports everything as normal: Location A's reorder was within thresholds. Location B's inventory is still green. The $12,000 redundancy is invisible to every metric the system tracks. This is the same structural gap that causes ERPs to stay silent when safety stock calculations drift into fiction. Same architecture. Different symptom. The ERP sees units. It never sees the relationship between them.
What Location-Siloed Inventory Actually Costs
The obvious cost: 18 to 25 percent excess inventory across locations. Industry carrying costs range from 20 to 30 percent of inventory value annually, covering warehousing, insurance, obsolescence, and the capital itself. For a distributor holding $2.5 million in inventory, the location-level redundancy traps $112,000 to $156,000 per year in unnecessary carrying cost. Money spent storing stock that already exists. Not because demand requires it. Because Location A's ERP does not know Location B's ERP exists. Even when they are the same ERP. Even when they share a database instance. The reorder logic is location-scoped by design.
The hidden cost: inter-warehouse transfers become the workaround. Each transfer runs $85 to $180 in labor, fuel, and handling. A mid-sized distributor running 8 to 15 transfers per month burns $8,000 to $32,000 per year on logistics that would not exist if the reorder had been prevented. The transfer takes 2 to 3 days. The requesting location runs lean during that window. Temporary stockouts trigger $400 to $1,200 in expedited customer shipments per incident. The freight line item is visible. The unnecessary transfer is not labeled as unnecessary. It shows up as a standard logistics cost. Nobody asks whether the inventory was already in the company. The system does not surface the question.
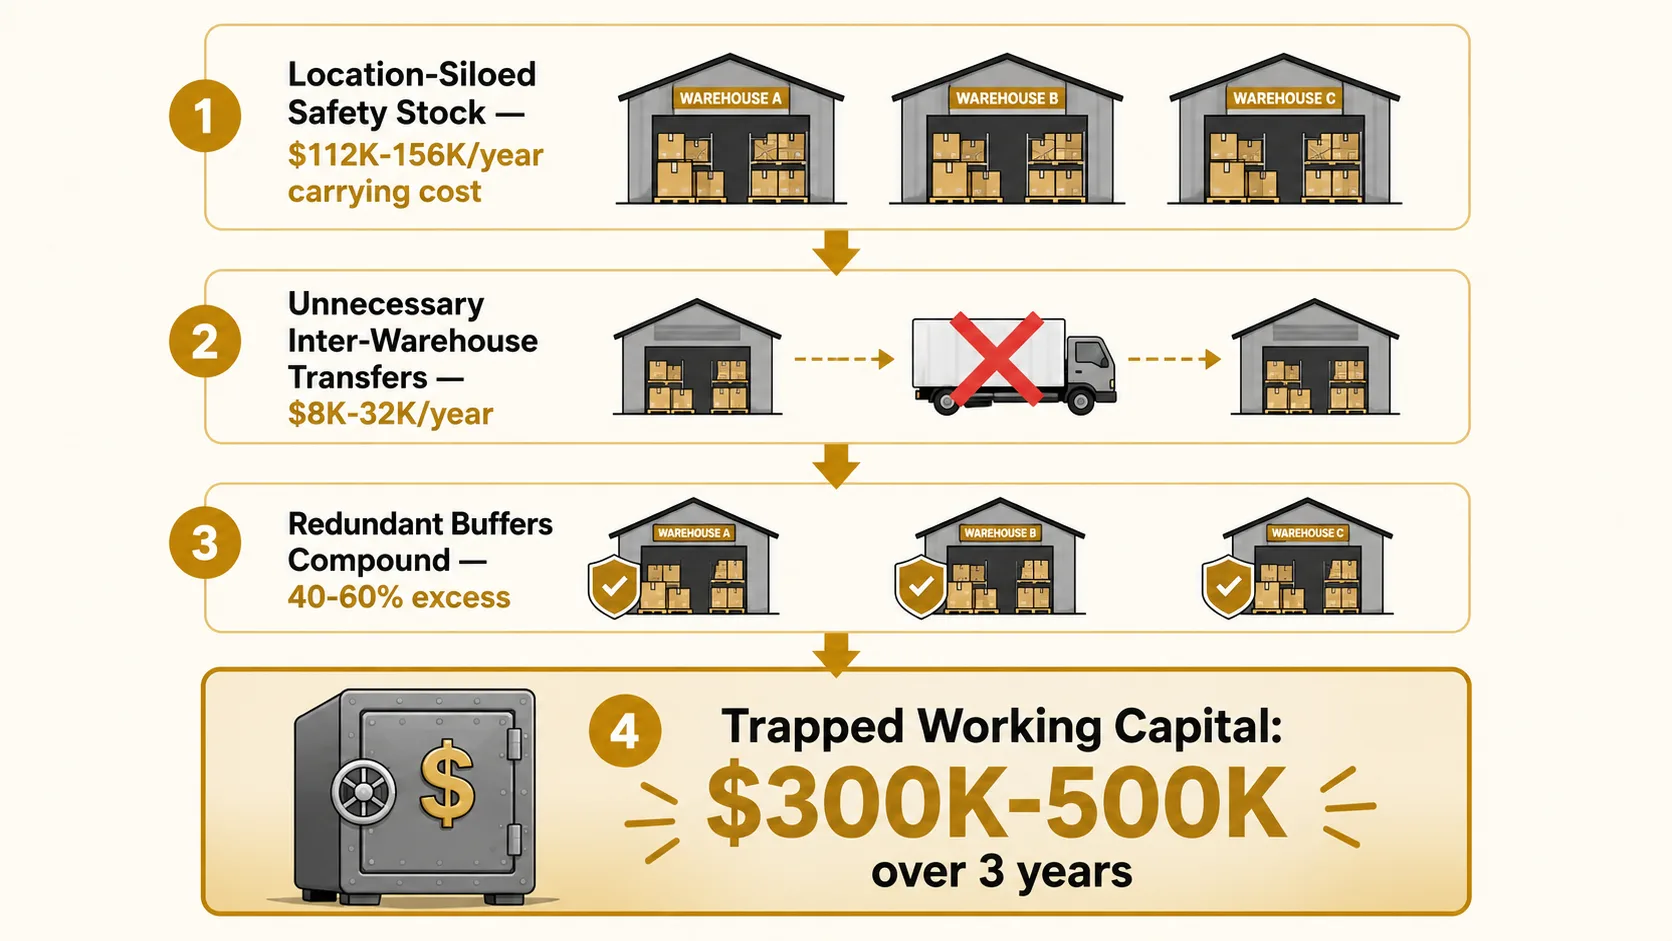
The compounding cost: safety stock redundancy across locations. Safety stock is calculated per location. Location A's buffer does not offset Location B's risk. Both warehouses stock deep against the same demand uncertainty. Over three years, a three-location distributor accumulates 40 to 60 percent more total safety stock than a pooled model requires. That is $300,000 to $500,000 in working capital trapped in redundant buffers. Money that could fund expansion, equipment, or a fourth location sits on shelves at three locations. All of it calculated correctly per the ERP's own logic. All of it redundant because the logic was never designed to pool risk across locations.
Why the Industry Accepts Multi-Location Inventory Redundancy
Enterprise inventory optimization tools solve multi-echelon inventory pooling. Blue Yonder and Kinaxis model demand correlation across locations. They optimize safety stock at the network level, not the warehouse level. They run scenario simulations across the full supply chain. The price: $150,000 to $500,000 per year with 12 to 18 month implementations. These tools are architected for Fortune 500 supply chains. They require dedicated planning teams, data integration consultants, and enterprise IT infrastructure. A mid-market distributor running $5 million to $50 million in revenue cannot close the math.
The mid-market has three options. Pay enterprise prices that cannot be justified. Run manual Excel pooling that breaks within two ordering cycles because demand curves shift and nobody updates the cross-reference tables. Or accept the redundancy as the cost of doing business. Most pick option three. Not out of neglect. Out of arithmetic. The alternatives were priced for companies 10 times the size. This is the structural gap market-validated intelligence is built to close. A problem with measurable cost and zero tools priced for the operators who carry it.
The ERP vendor relationship reinforces the acceptance. A purchasing director who has been told by their ERP account manager that multi-warehouse solves cross-location visibility eventually learns the truth. The feature shows inventory across warehouses. It does not coordinate purchasing across them. The director asks about pooled safety stock. The account manager pitches the upgrade tier. The price lands. The director stops asking. The reorder logic keeps firing per location. The redundancy compounds. Nobody is failing. The tooling priced for this solution does not exist at this scale. The director is not the problem. The gap between what multi-warehouse was sold as and what it actually does is the problem.
What Changes When Inventory Visibility Pools Across Locations
Cross-location demand correlation is not an ERP replacement. It is a visibility system that reads from existing systems. The moment a reorder triggers at Location A, the system checks every other location for the same SKU. Surplus at Location B is flagged before the purchase order is approved. The reorder is either cancelled, reduced, or redirected. The $12,000 surgical kit order becomes a $0 transfer from Location B. One phone call. Not one purchase order.
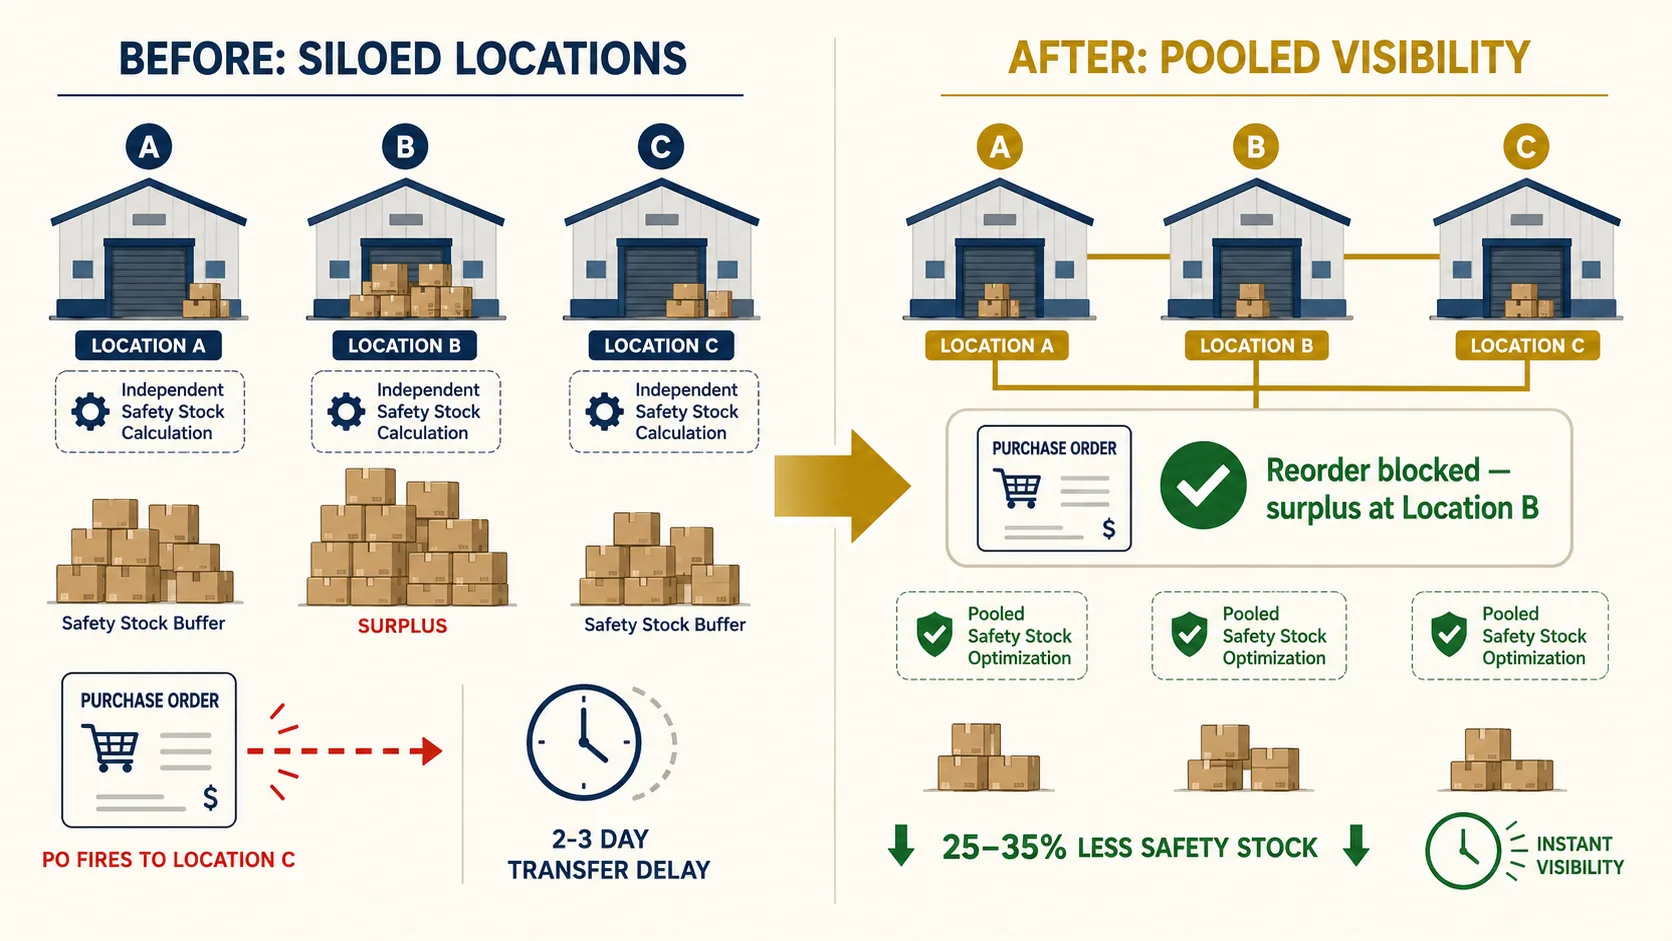
Pooled safety stock calculations reduce total buffer by 25 to 35 percent without increasing location-level stockout risk. Location A's demand uncertainty is partially offset by Location B's surplus capacity. The math that was always possible becomes operational. Transfer logic optimizes inter-warehouse moves: fewer transfers, better timed, larger loads. Transfer frequency drops 50 percent. The transfers that remain are planned, not reactive. The shipping cost drops with the frequency.
Within 120 days, a distributor with a $2.5 million inventory base and three locations sees an 18 to 22 percent inventory reduction. $85,000 to $140,000 in freed working capital. Zero incremental ERP licensing. No migration. No new system to learn. The ERP still tracks what is on the shelf at each location. The multi-property intelligence system tracks whether what is on the shelf at Location B makes what was ordered at Location A unnecessary. The data was always in the ERP. It was just never asked the cross-location question. The cross-location system asks it. The inventory that was already owned stops being bought again.
What to ask next
Common questions operations directors ask after reading this:
How much inventory redundancy do multi-location distributors carry?
Why does ERP multi-warehouse not prevent duplicate inventory across locations?
What is the cost difference between pooled and siloed safety stock calculations?
How do enterprise inventory optimization tools compare for mid-market distributors?
Related read: The same ERP architecture that blinds locations to each other also enforces supplier minimums one line at a time with no cross-SKU logic — where MOQ padding adds 30-45% dead stock to every padded purchase order.
Related read: The same ERP architecture that keeps warehouses blind to each other also forces buyers to pad every purchase order to supplier minimums — where cross-SKU consolidation drops MOQ-driven dead stock by 55 to 70 percent.
Related read: The same ERP architecture that isolates reorder logic per warehouse also fails to detect demand velocity that outruns fixed reorder thresholds. Different symptom. Same structural gap. The ERP sees units on a shelf. It never sees how fast those units are disappearing or whether another shelf already has them.
Related read: The mid-market tooling gap appears across distribution. MRO stockrooms run 40 to 60 percent over target because reorder logic treats a critical bearing that stops production and a shelf bolt identically. Same ERP. Different industry. Same root cause.
Get a Diagnostic on Cross-Location Redundancy
The diagnostic pulls 12 months of purchase orders and inventory snapshots across every location. It maps exactly how much inventory is being bought that already exists at another warehouse. By SKU. By dollar amount. By location. The output is not a recommendation. It is a number the current systems cannot produce: the total spent on inventory the company already owned. No software to buy. No ERP migration. Just the math the multi-warehouse module was never designed to calculate.
How TheiaOps builds cross-location intelligence for mid-market distributors →