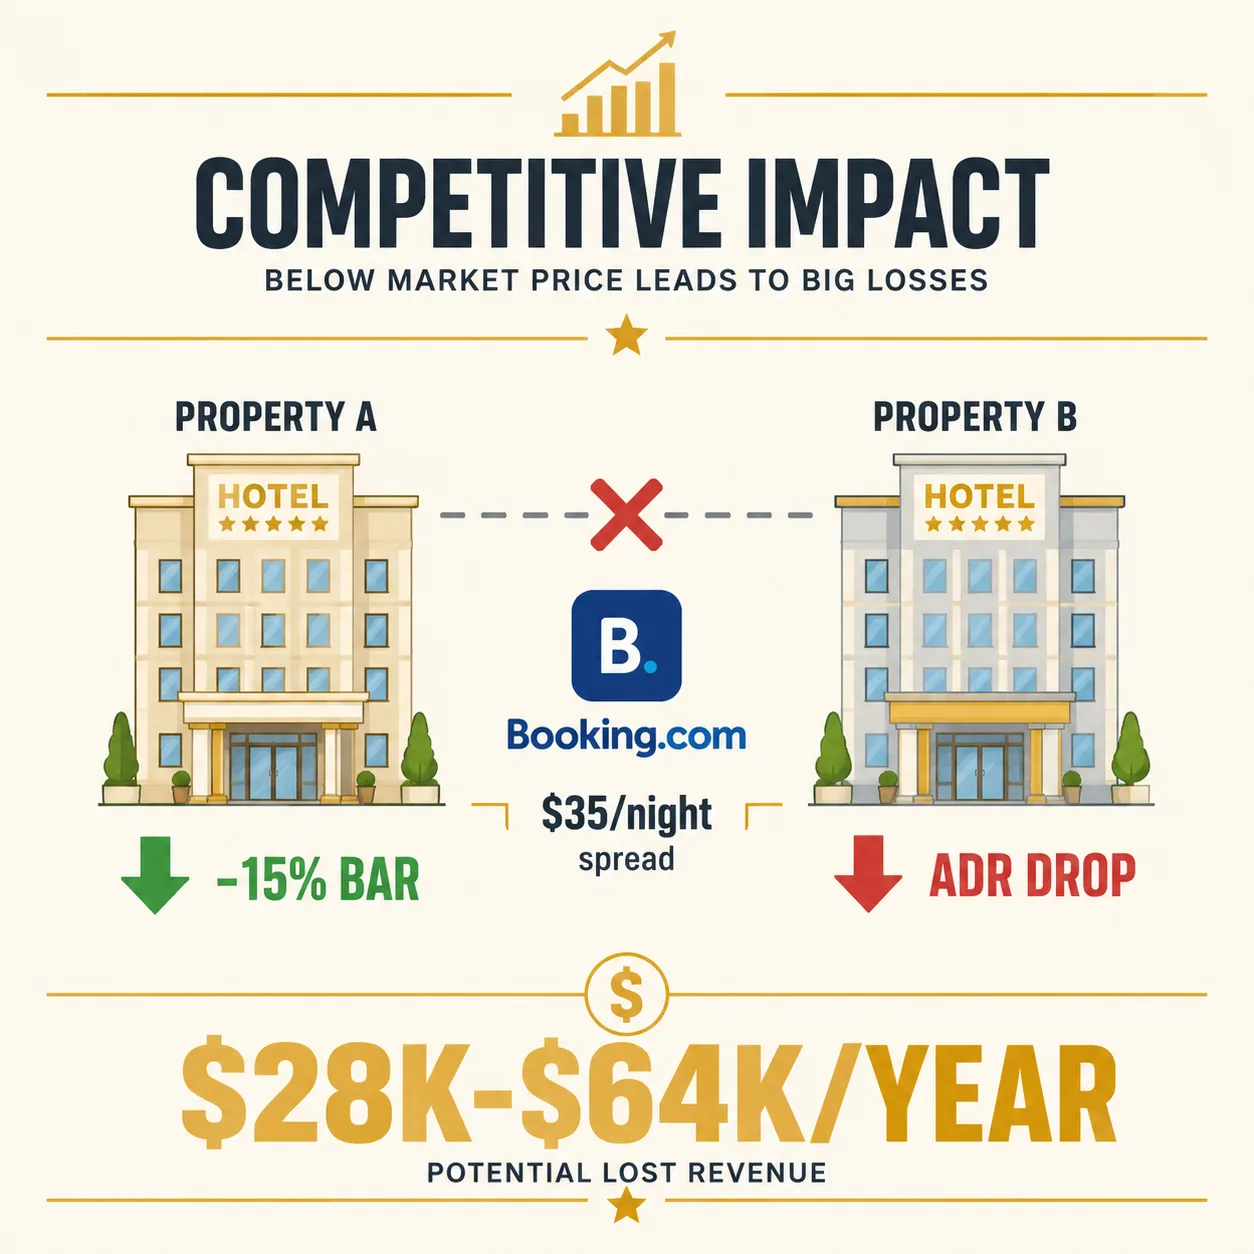
Rate parity fails inside a hotel group because the PMS distributes rates per property and never checks whether one property just undercut another. Property A drops its rate, Property B holds, and the OTA surfaces the cheaper listing to the same guests.
It is Thursday afternoon. A revenue manager at Property A drops BAR by 15 percent to capture a soft weekend. Property B, three miles away on the same highway, holds rate. Same OTA. Same date range. Same guest segment. Booking.com’s algorithm sees two listings from the same hotel group. It surfaces the cheaper one. Property B’s bookings stall. Neither manager knows what the other did. The PMS told them nothing. The channel manager pushed the rate. The revenue walked.
What Does Cross-Property Rate Cannibalization Look Like in Practice?
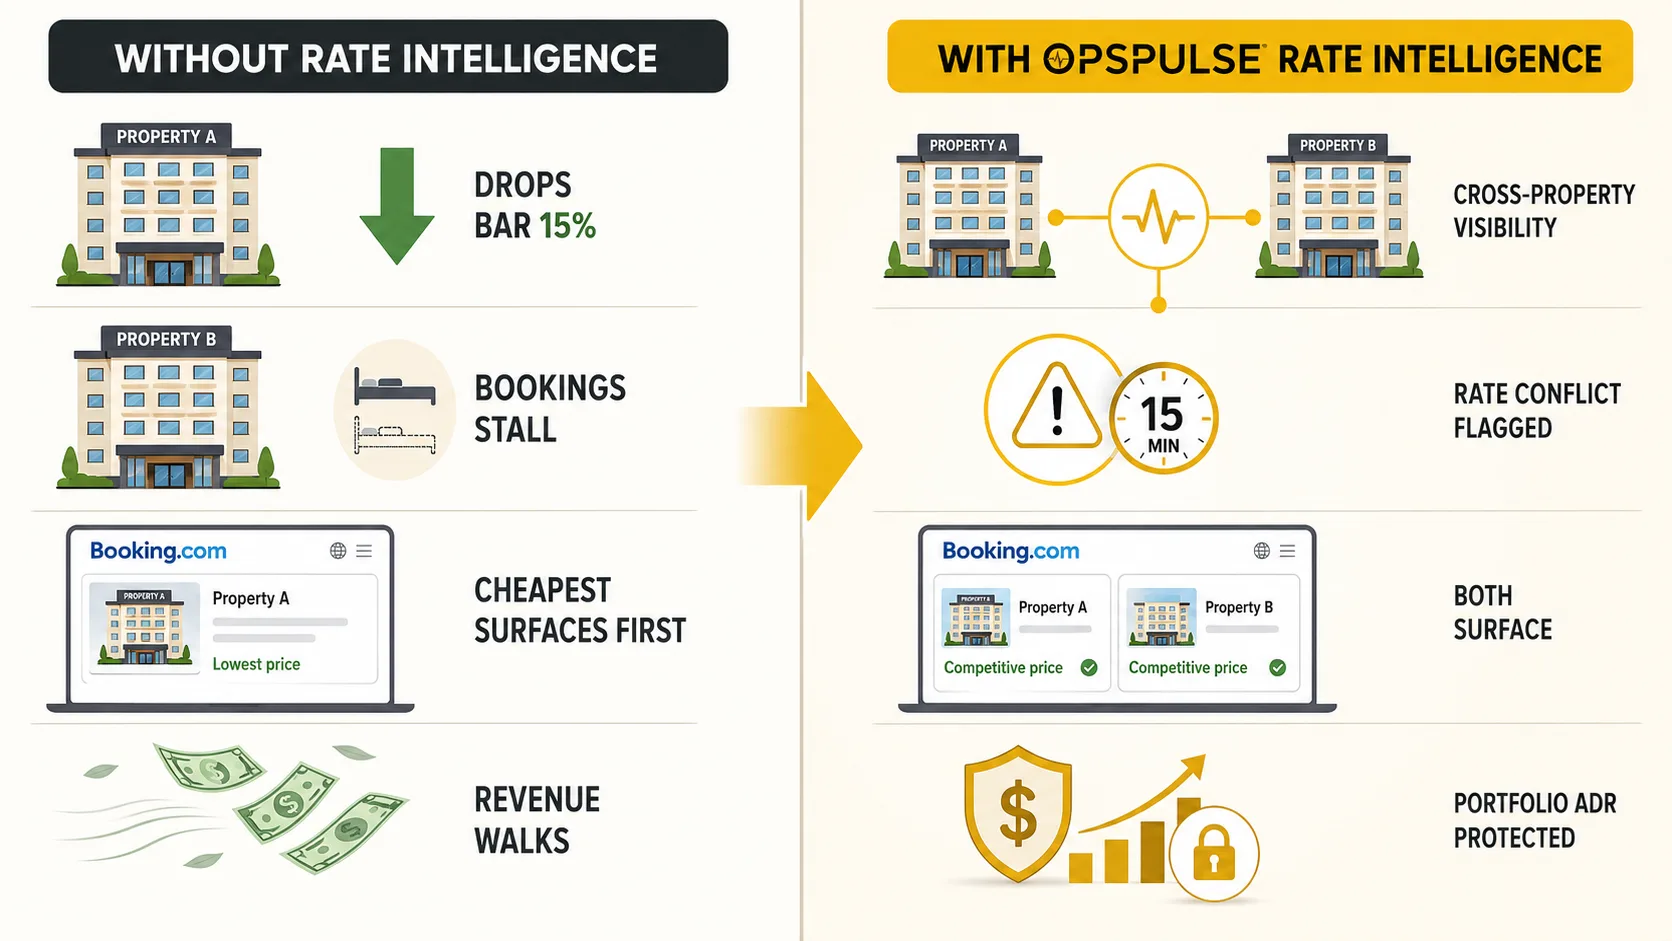
Property A drops rate. Property B loses bookings. Neither system connects the two events. The revenue manager at Property A did the job correctly. A soft weekend on the books. A 15 percent BAR reduction is standard practice for filling compression gaps. The channel manager pushed the rate to Booking.com within seconds. Property B’s GM watched occupancy stall halfway through the booking window and assumed market softness. The actual cause was three miles up the road, inside the same company, running on the same PMS. Nobody knew. The PMS processed two rate changes from two properties. It never asked whether they competed.
Every hotel group with more than one property in the same city has this dynamic. The geography does not matter. Two limited-service properties near an airport. Three boutique hotels in the same downtown corridor. A conference center hotel and an extended-stay property 10 minutes apart. When booking windows compress and the cheapest option wins, the algorithm does not check ownership. It checks price. And the price that wins is often the one the group itself created.
Why Cannot PMS and Channel Managers Prevent Self-Undercutting?
PMS revenue modules are structurally per-property. Rate rules, restrictions, and BAR adjustments operate inside a single property’s inventory silo. There is no mechanism for “if I drop rate, does this cannibalize my sister property?” The architecture was never designed to ask. When Opera PMS processes a rate change at Property A, it writes the update to Property A’s rate table. It does not read Property B’s rate table. It does not know Property B exists. The same is true for Maestro. For RoomKey. For every PMS built before cross-property rate intelligence became a conversation.
Channel managers like SiteMinder, Cloudbeds, and D-EDGE distribute rates outward. They push to OTAs. They do not cross-reference internally. Their function is distribution throughput, not portfolio intelligence. The channel manager sees Property A’s rate heading to Booking.com and sends it. It sees Property B’s rate heading to the same Booking.com and sends that too. They land on the same listing feed. The algorithm does what algorithms do: it ranks by conversion probability. Cheaper wins.
Revenue management system tools like IDeaS G3 and Duetto GameChanger price per room. They break even at 50 or more keys per property. A mid-market group with five to 20 boutique properties has no cross-property rate intelligence connector. Enterprise RMS tools exist. They price rooms. They do not check whether Property A just undercut Property B on the same OTA for the same dates. The gap is architectural, not operational. It is also profitable for the vendors. PMS companies license per-property. Cross-property rate intelligence would cannibalize the per-instance revenue model. Nobody who sells per-property software has an incentive to build a multi-property view that shows conflicts between properties.
What Does Self-Cannibalization Cost a 10-Property Hotel Group?
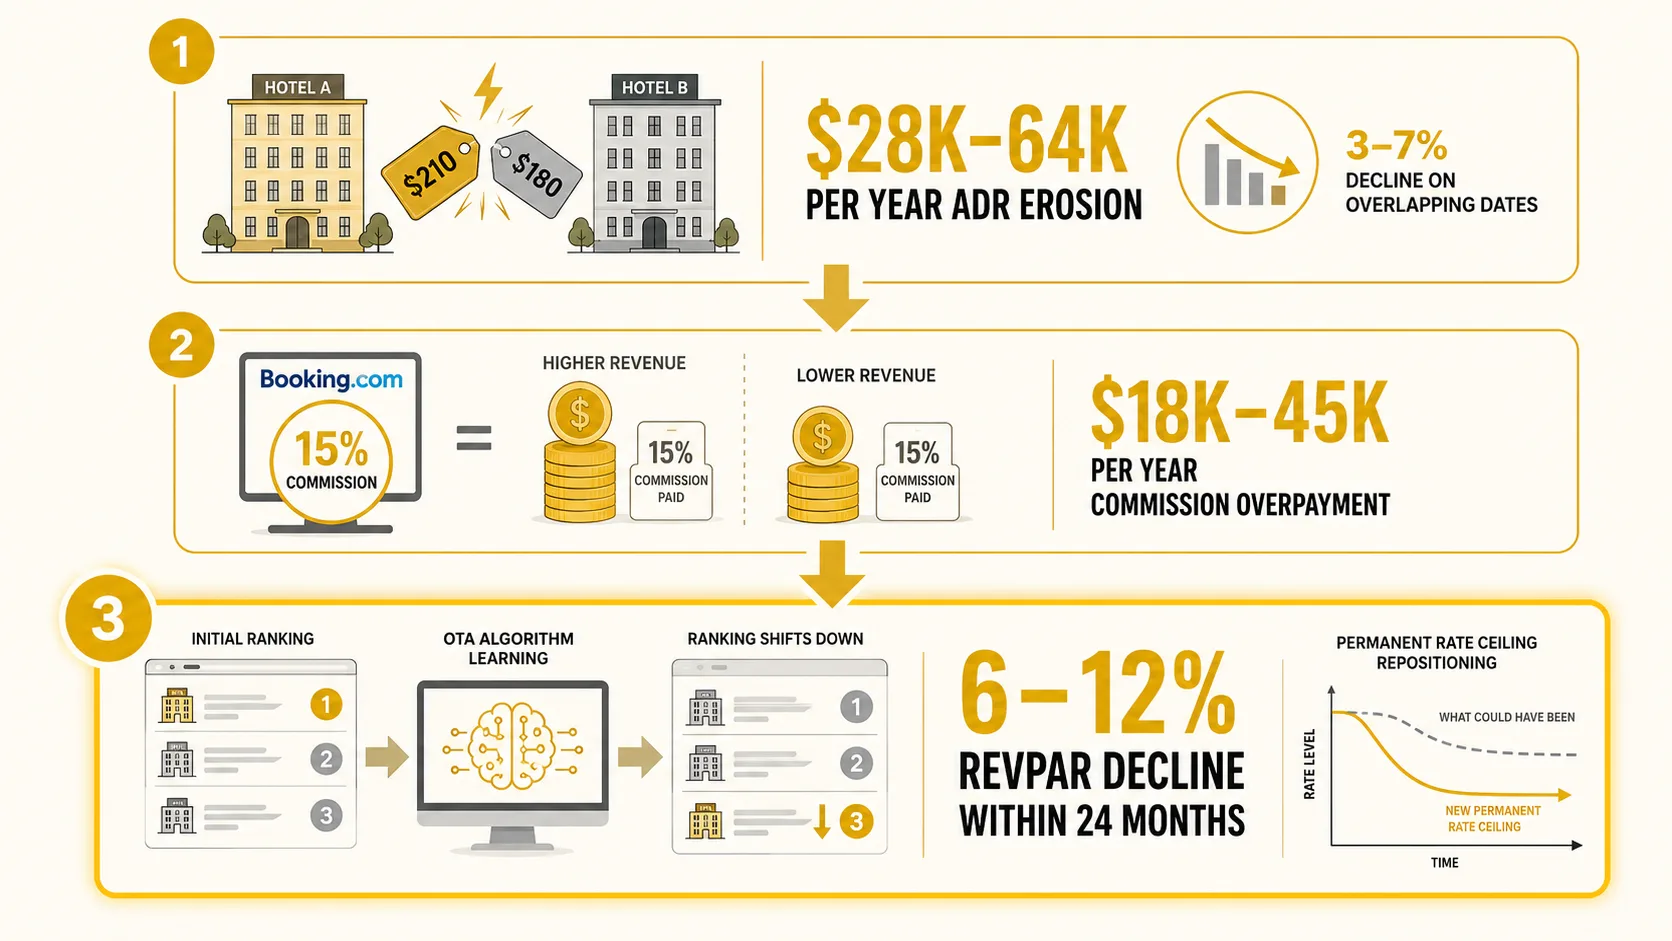
The obvious cost is depressed average daily rate from self-cannibalization. A 10-property group loses $28,000 to $64,000 per year. Three to seven percent ADR erosion on overlapping date ranges. When the cheapest of two same-group properties captures the Booking.com ranking, the booking that should have gone to the higher-rate property at $189 instead went to the lower-rate one at $154. A $35 spread per room night. Fifty cannibalized room nights per month across the portfolio. The math compounds quickly. And nobody on the revenue team can trace the lost nights because the PMS reports property-level revenue, not portfolio-level cannibalization.
The hidden cost is OTA commission overpayment on bookings that delivered less revenue. That adds $18,000 to $45,000 per year. Online travel agency commission rates typically run 15 to 20 percent, according to Cloudbeds’ 2026 OTA commission rate guide. A booking at $154 pays $23.10 to $30.80 in commission. A booking at $189 pays $28.35 to $37.80. The lower-rate property pays nearly the same absolute commission for less revenue. Meanwhile, the higher-rate property loses the booking entirely and gets nothing. The group paid two commissions on two properties to generate one cannibalized booking. Bad math made invisible by per-property reporting.
The compounding cost is portfolio rate-ceiling repositioning. OTA algorithms learn over time. Within 18 to 24 months of persistent self-cannibalization, Booking.com’s ranking algorithm learns to always surface the cheaper property first. The algorithm optimizes for conversion. It sees Guest searches, Property A appears at $154, Property B appears at $189. Guest clicks Property A. Guest books Property A. The algorithm records: this price point converts. It re-ranks accordingly. The group’s rate ceiling is permanently repositioned downward. A six to twelve percent portfolio RevPAR decline compounds quarterly and becomes structural. Rates cannot be raised later because the algorithm trained buyers to expect the lower price. The Booking.com ranking algorithm rewards conversion velocity. Self-cannibalized groups feed it exactly the signal it rewards.
Why Do Mid-Market Groups Accept Revenue Leakage They Cannot See?
The alternatives do not fit the mid-market. Enterprise RMS tools price per room and need 50 or more keys per property. Manual rate parity monitors like OTA Insight and RateGain track external competitors. They check whether the Marriott next door is undercutting a property on Booking.com. They do not check whether Property B in the same group is competing against Property A on the same OTA for the same dates. External parity monitoring is a different product category from internal cross-property intelligence. The tools that exist solve a different problem.
PMS vendors license per-property. Cross-property rate intelligence would cannibalize their own per-instance revenue model. Opera charges per property. Maestro charges per property. RoomKey charges per property. No vendor who sells software one property at a time has an incentive to build a feature that shows how properties compete against each other. The mid-market group is structurally invisible to the tools that could solve this. Revenue managers do their jobs. The PMS does its job. Nobody owns the gap between them. The same operational pattern appears across hospitality management, as described when regional directors spend every Monday pulling reports from multiple PMSs into one spreadsheet. The data exists. It lives in different databases. Nobody joins them.
The acceptance is not complacency. It is invisibility. A GM watching ADR slip month over month sees a market trend. Portfolio RevPAR decline in the monthly P&L looks like macro softness. The revenue manager who dropped the rate was optimizing local RevPAR. They succeeded at their objective. The PMS reported strong performance at Property A. The P&L showed weakness at Property B. Nobody connected the two. The money disappeared into the gap nobody owns. This is the same cross-property blindness pattern described when one hotel scrambles with understaffing while another has idle labor. The systems are per-property. The problems are portfolio-wide. The bridge between them does not exist yet.
What Changes When Cross-Property Rate Intelligence Is Added?
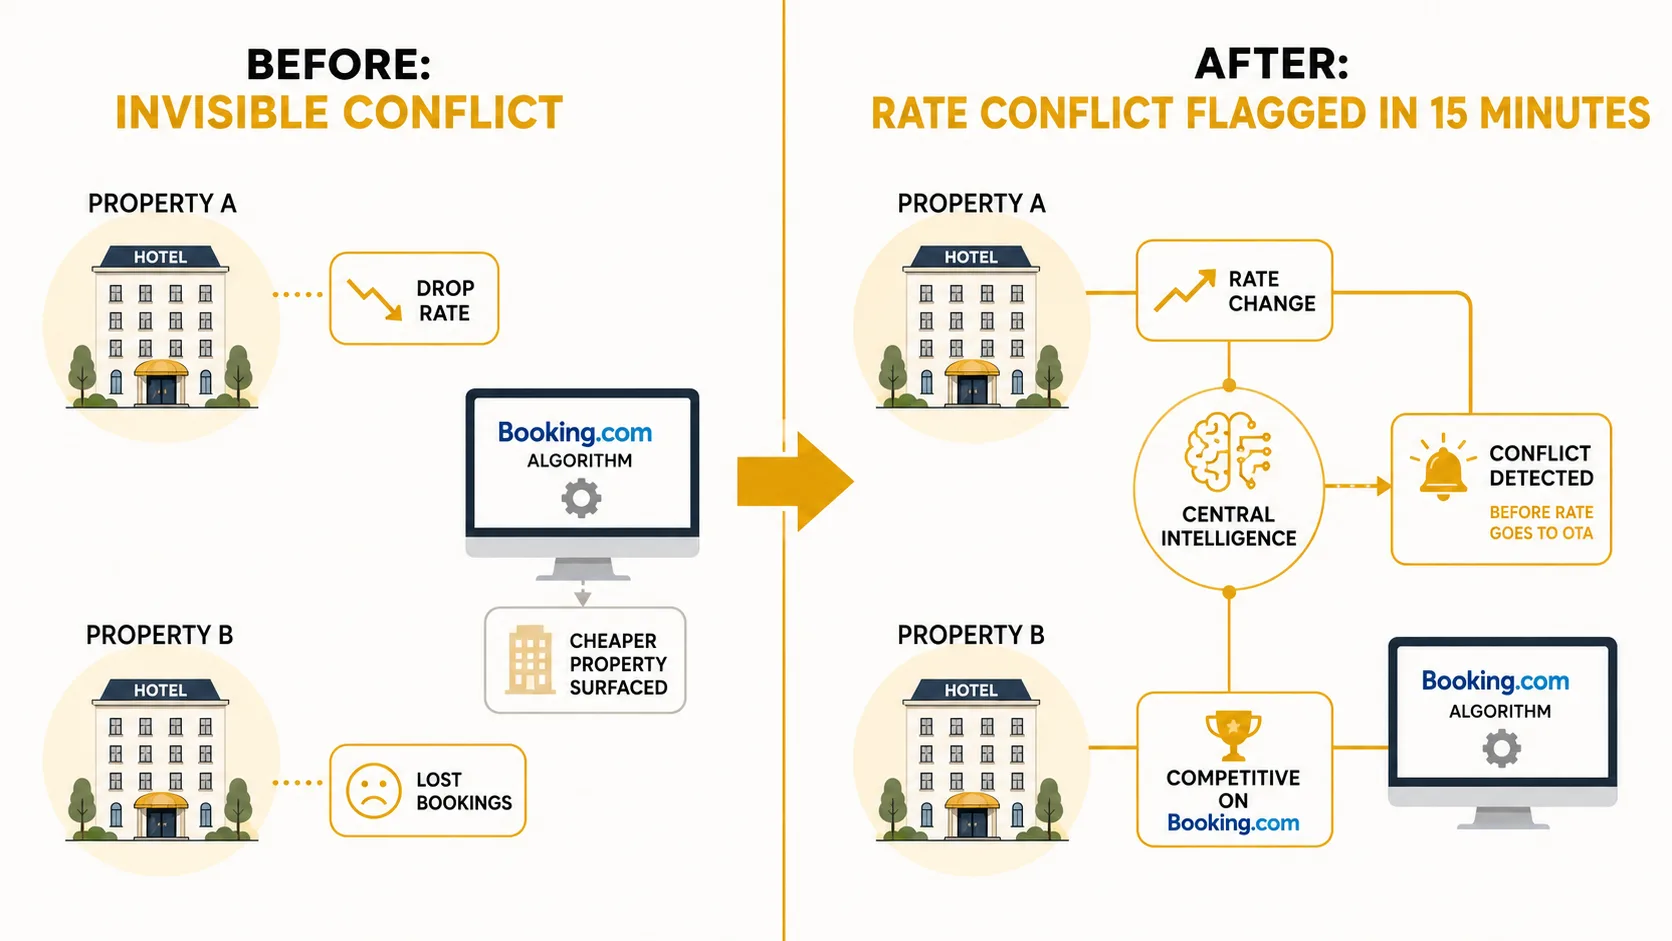
Cross-property rate visibility is not a new RMS. It is a rate visibility add-on that reads from existing PMS systems. When Property A drops BAR, the system checks Property B’s BAR on the same OTA for the same date range within 15 minutes. The conflict is surfaced before the booking window absorbs the damage. Portfolio-wide rate rules . minimum distance-based parity thresholds, segment overlap detection, date-range conflict scoring . stop self-cannibalization before revenue walks out. No new PMS. No RMS implementation. No channel manager replacement. The same tools. The same systems. One additional connector that asks the question the PMS never did.
A 10-property group implementing cross-property rate intelligence recovers $26,000 to $58,000 in the first quarter from stopping self-inflicted ADR erosion alone. The commission overpayment on cannibalized bookings drops 40 to 60 percent. The OTA algorithm stops being trained on the group’s own cheapest rate. Within six months, the portfolio rate ceiling stabilizes. The pricing decisions that were made locally, in isolation, now carry portfolio context before they go live. The same operational pattern that recovers phantom labor costs from invisible task duplication recovers phantom revenue from invisible rate conflicts. Both patterns share the same root cause: per-property systems cannot see cross-property problems. Adding the cross-property view surfaces the waste that was always there.
The fix does not require replacing the tools that took years to implement. It requires extending them with one question: if I change this rate, does it undercut another property in the same group? The PMS already holds the rate tables. The channel manager already holds the distribution data. The question has never been asked systematically. Asking it changes the outcome. The technology is the connector. The value is the revenue that stops walking out the door.
What to ask next
Common questions operators ask after reading this:
How do I check if my hotels are undercutting each other on Booking.com?
What does cross-property rate cannibalization cost per year?
How do hotel groups enforce rate parity without an RMS?
Why do not channel managers prevent same-group rate undercutting?
Get a Cross-Property Rate Cannibalization Diagnostic
A diagnostic identifies every date, property pair, and OTA where rate overlap is active inside the portfolio. The output is a list of cannibalized revenue nights per property per month, the ADR erosion curve by quarter, and the exact commission overpayment on bookings the group competed against itself to capture. Before the next revenue meeting. Before the next rate decision that Property B never saw coming.