
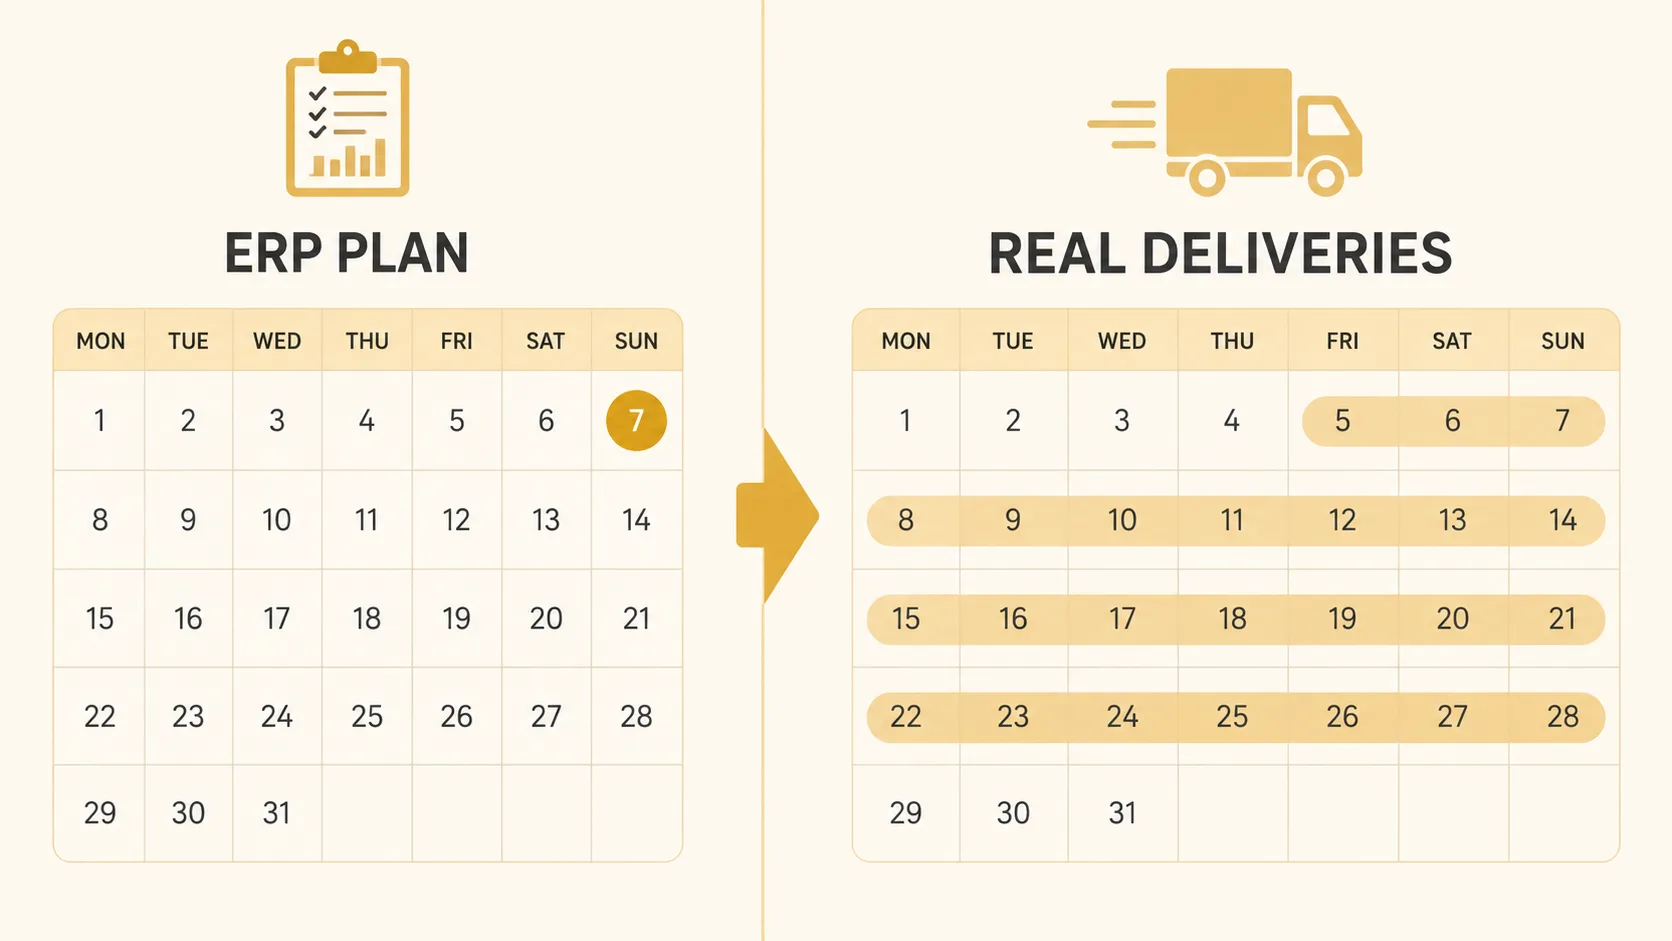
ERPs assume suppliers deliver on time because the lead time field is entered once at supplier setup and never updated, never questioned, and never accurate. The ERP plans around a single number while actual delivery performance spreads across a range the system never sees.
The purchasing manager sits down for the monthly inventory review. The ERP review screen shows 42 days of cover on the top 200 SKUs. Comfortably above the 30-day target. Then the warehouse supervisor walks in with a clipboard. Three pallets of surgical tubing. Already stacked floor to ceiling in aisle 7. Ordered because "the last shipment took 22 days instead of the 7 in the system." The supervisor is not getting burned again. The ERP says lean. The warehouse floor says otherwise. The gap between them is a single number: the lead time field, entered once at supplier setup, never updated, never questioned, and never accurate.
Why ERP Lead Time Fields Produce Bad Reorder Decisions
ERPs like NetSuite, SAP Business One, Epicor, and Microsoft Dynamics treat lead time as a static attribute. One number per supplier-SKU combination. Entered at vendor setup. Rarely revisited. No variance tracking. No trend detection. No degradation alerts. When Acme Supply's actual lead time drifts from 7 days to 9 to 14 over six months, the ERP keeps planning replenishment to a 7-day cycle. The purchasing module triggers reorders on a fictional number. The buyer, who has been burned before, manually overrides with a 14-day buffer "just in case." That override becomes the new normal. Invisible to reporting. Invisible to the ERP cost analysis. Invisible to leadership who ask why inventory keeps swelling quarter after quarter.
This is not configuration error. It is an architectural limitation. ERP procurement modules were built for an era when supplier performance was stable and variance was noise. In today's supply chains the signal has reversed. Post-COVID supplier consolidation. Regional shortages. Fragmented logistics. Lead time variance is the signal. ERPs filter it out.
The procurement system has no feedback loop. The receiving dock logs the actual delivery date. The purchasing module never reads that date back into the lead time field it uses to calculate the next reorder. The data exists in the same database. The architecture never connects the two. A purchasing manager on r/supplychain described it bluntly: "The biggest problem we are having right now is that the lead time variances are huge due to international logistics, and the system isn't seeing what is actually happening." The system sees the order date. It sees the receipt date. It stores both. And it uses neither to correct the number it plans from next month.
What Static Lead Times Actually Cost
The obvious cost: 18 to 32 percent excess inventory from manual lead-time padding. For a $3M medical supply distributor with $800K average inventory, that is $144,000 to $256,000 per year at an 18 percent annual carrying cost. This is buffer the buyer added because the ERP number could not be trusted. It is invisible on any P&L line item. It is baked into "standard" inventory levels. Nobody budgets for it because nobody named it.
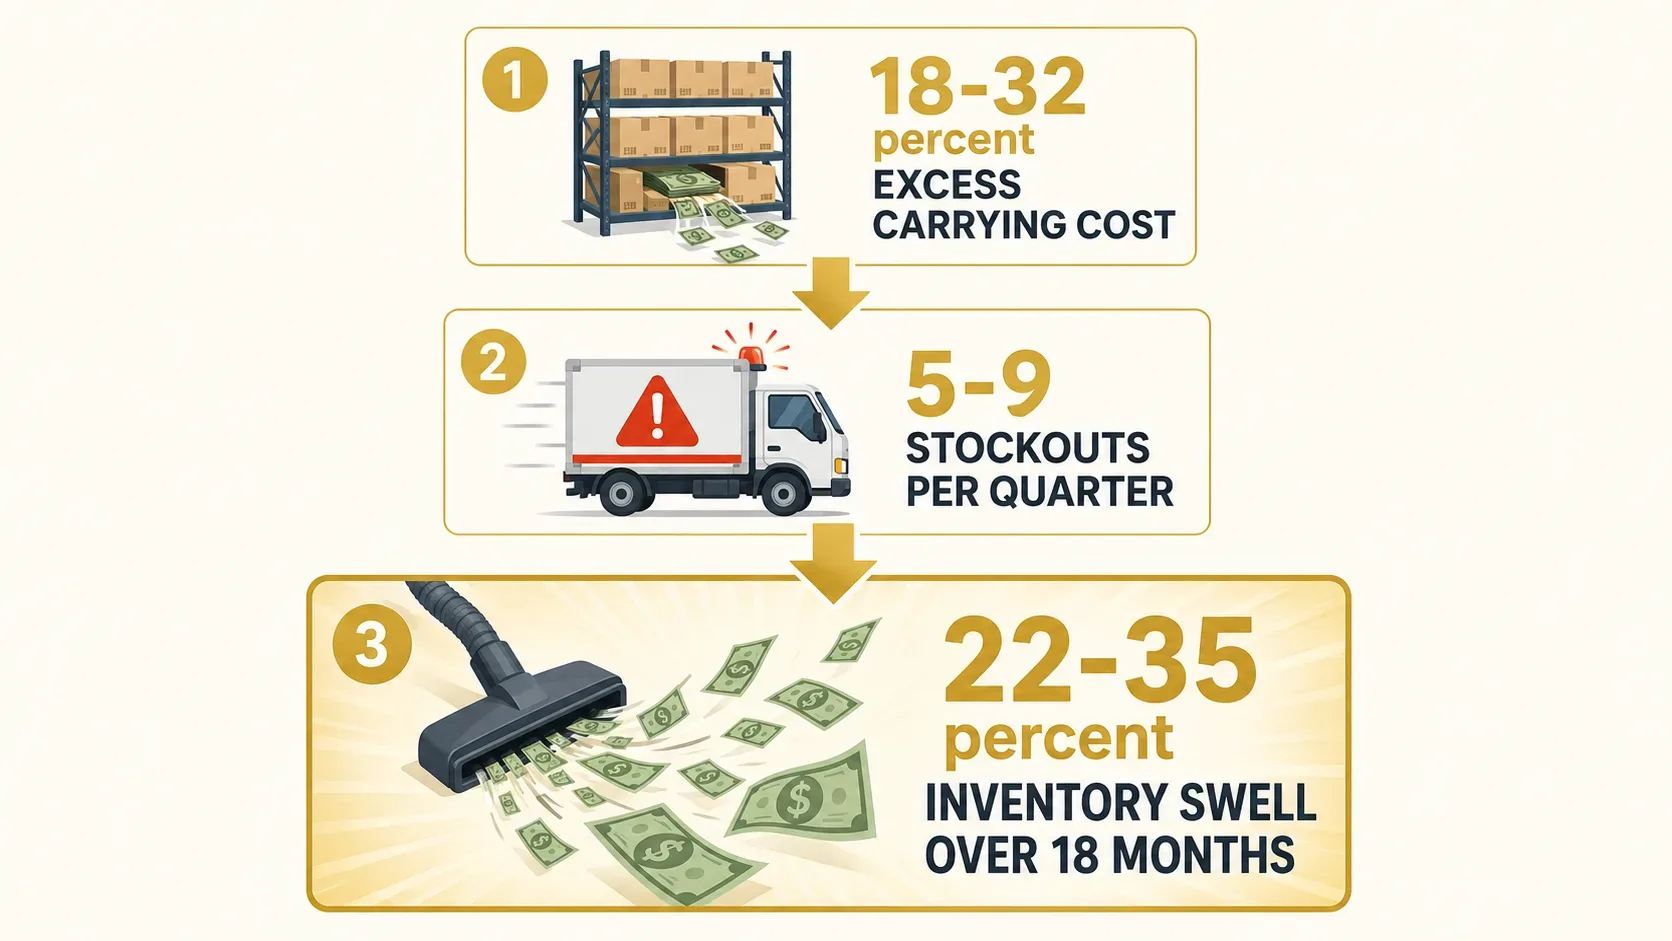
The hidden cost: 5 to 9 stockout incidents per quarter on the SKUs where actual lead time exceeds the ERP assumption. Each stockout on a surgical supply SKU costs $2,800 to $8,500 in expedited freight. Worse: roughly 1 in 4 triggers a hospital procurement review that puts the entire account relationship at risk. $120,000 to $350,000 per year per account. The expedited freight line item is visible. The link back to the lead time field that caused the stockout is not.
The compounding cost: buffer-on-buffer growth across quarters. The buyer adds 2 days here. 3 days there. Across 200 SKUs with 3 to 5 suppliers each. After 18 months, inventory swells 22 to 35 percent beyond what demand requires. $176,000 to $280,000 trapped in working capital. Meanwhile, the 2 to 3 worst-performing suppliers with 20 to 35 percent late rates and 40 to 60 percent lead time variance remain invisible. No supplier scorecard. No trend alert. No flag. They degrade further while leadership blames "supply chain issues" without being able to name which supplier or by how much.
Why the Mid-Market Accepts Inaccurate Lead Time Data
The alternatives do not fit the mid-market. Enterprise supply chain suites from Kinaxis and Blue Yonder start at $150,000 per year. They require dedicated planning teams, data integration consultants, and implementation timelines of 12 to 18 months. Viable at $500M revenue. Absurd at $5M to $50M. The math does not close.
At the other end, spreadsheet-based supplier trackers live on the purchasing manager's desktop. Disconnected from the ERP reorder logic. They track what happened but cannot change what the system does next. The manager updates the tracker on Friday. The ERP places a reorder on Tuesday using the same stale lead time field it used last month. The tracker is a record. Not a control.
ERP vendors offer "supplier performance" add-on modules at $15,000 to $40,000 implementation. They track on-time delivery percentages. They do not feed variance data back into replenishment calculations. The module reports that a supplier delivered late 40 percent of the time. The purchasing module still plans the next reorder at the original 7-day lead time. Two modules. Same ERP. No connection. The feature was sold as supplier intelligence. What shipped was a report.
The market structure reinforces acceptance. A purchasing director asks the ERP account manager about lead time variance tracking. The account manager pitches the upgrade tier. The price lands. The director stops asking. The reorder logic keeps firing on the original numbers. The buffer keeps growing. This is not negligence. The tools priced for this problem do not exist at this scale. The director is not the problem. The gap between what the ERP field was designed for and what supply chains actually require is the problem.
What Changes When Lead Times Reflect Actual Supplier Performance
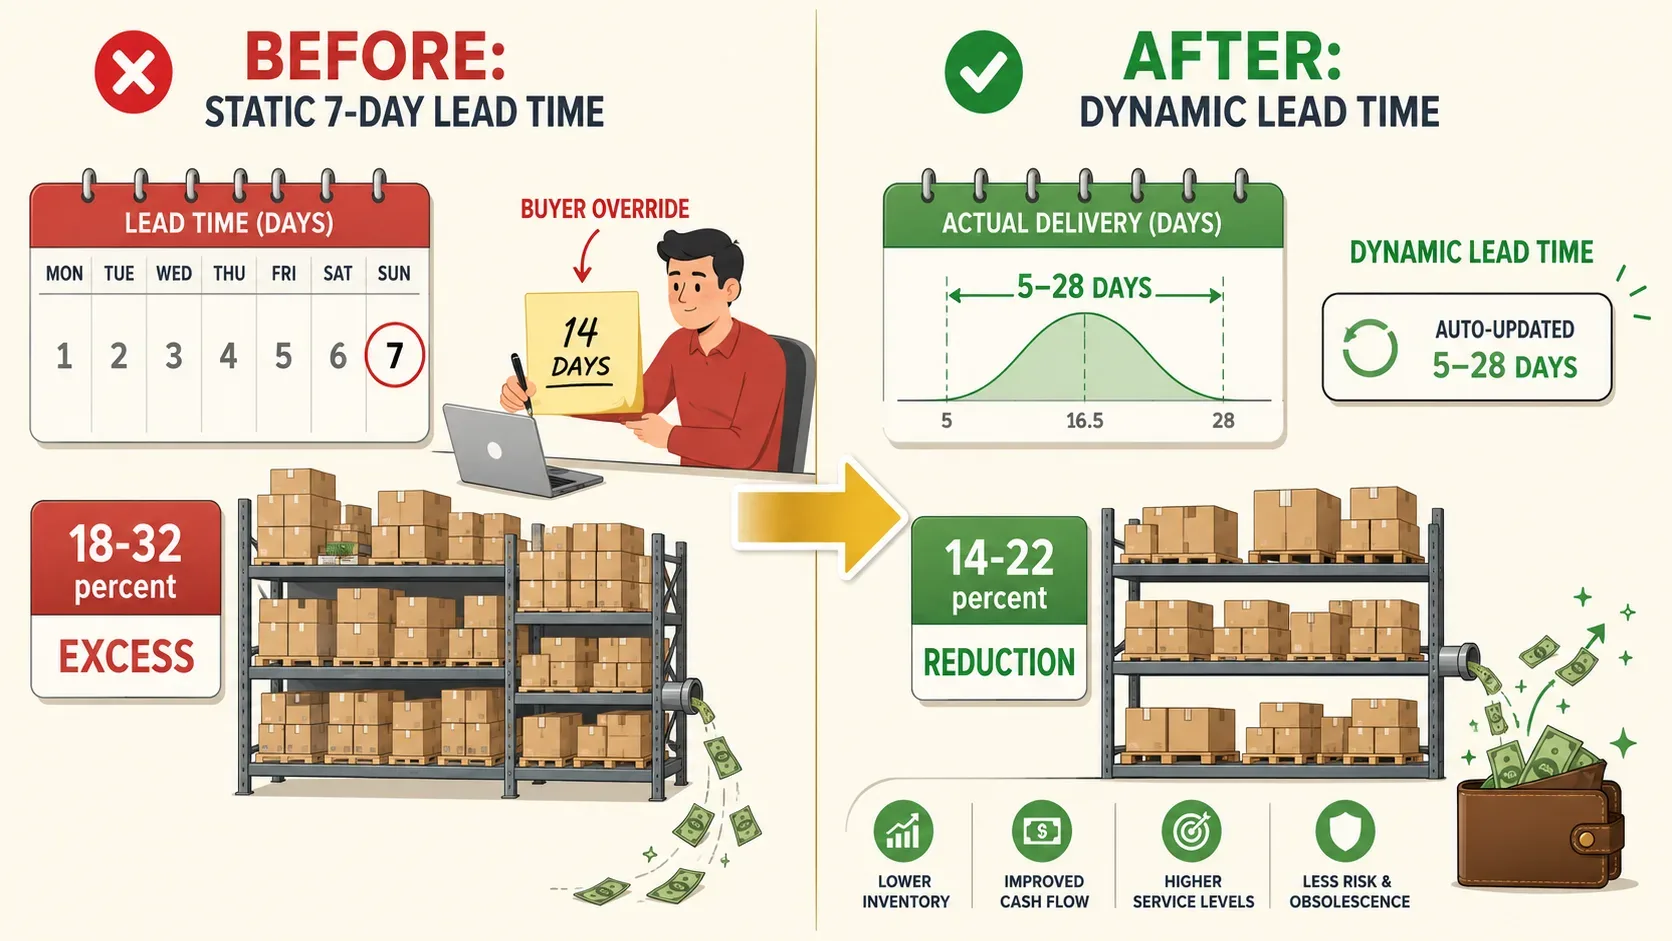
Actual lead time tracking means measuring the distribution per supplier-SKU combination. Not "on-time percentage." The full spread. Applied to the top 150 to 200 replenishment-driven SKUs. Within 30 days: identification of the 3 to 5 suppliers whose variance drives 60 to 80 percent of buffer bloat. Within 60 days: dynamic lead time inputs replace static assumptions in reorder calculations. The ERP still runs purchasing. The lead time it uses is the 85th percentile of actual performance. Not the fiction entered at setup. Within 90 days: inventory drops 14 to 22 percent without increasing stockout risk. The buffer is now accurate, not padded. The 2 to 3 worst suppliers are renegotiated or replaced. The buyer stops manually overriding reorder quantities. Working capital freed: $112,000 to $176,000 for a $3M distributor.
The ERP was never the wrong tool. It was working with the wrong number. Fix the number. The math fixes itself. This is the same pattern ERPs reproduce when safety stock calculations drift into fiction. Same architecture. Different symptom. The ERP runs calculations perfectly on inputs that stopped being accurate three quarters ago. The question is not whether the ERP can do the math. The question is whether the number it is doing the math on matches what is actually happening at the receiving dock.
What to ask next
Common questions operators ask after reading this:
How do I calculate the real cost of supplier lead time variability across 200 SKUs?
What is the difference between on-time delivery percentage and lead time accuracy?
Can my existing ERP track supplier performance without an expensive add-on module?
How much safety stock should a mid-market distributor carry when lead times are unpredictable?
See Which Supplier-SKU Combinations Are Costing the Most in Buffer Inventory
The diagnostic pulls 12 months of purchase order and receiving data. It calculates actual lead time distribution per supplier-SKU combination. It flags the specific pairs where variance drives the most excess buffer cost. The output is not a recommendation. It is a list of 5 supplier-SKU combinations with exact variance data the ERP has but never used. Root cause identification in under 15 minutes. No software to buy. No ERP migration. Just the math the existing purchase order log was never designed to calculate.
How TheiaOps builds inventory intelligence for mid-market distributors →