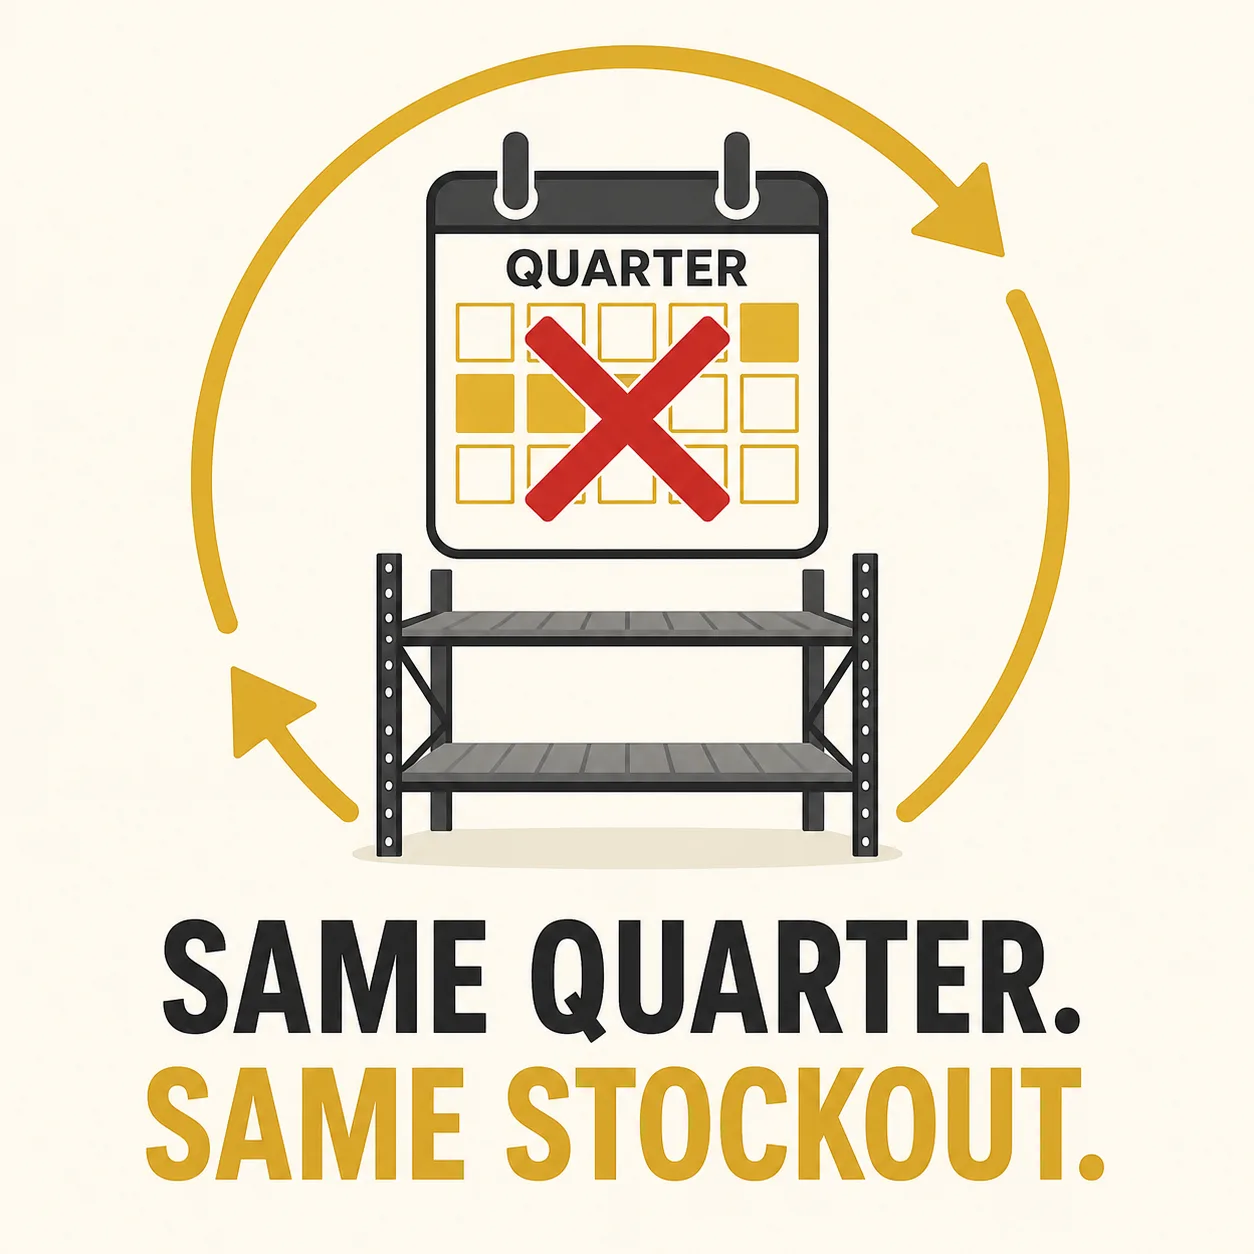
Medical suppliers stock out of the same SKUs every quarter because the ERP plans around a 12-month moving average that flattens seasonal demand spikes. The hospital order arrives every quarter like clockwork, the moving average smooths it into 26 units a week, and the same SKU hits backorder every single time.
The purchasing manager at a $14 million medical supply distributor opens the ERP on Monday morning, week one of Q3. The surgical kit SKU that stockpiled out in April, June, and last September is showing 48 units on hand. The ERP calls it adequate. The reorder point is 40. The forecast says 26 units per week. But the hospital order that arrives every quarter like clockwork, the one for 600 units placed the first Tuesday after the quarter opens, is not visible in any of the ERP's numbers. The moving average flattened it into 26. The same SKU will be on backorder by Thursday afternoon. Same scramble. Same UPS Red label. Same warehouse manager pulling a 14-hour shift. Same SKU. Same quarter. Same year. Nobody is surprised. Everyone is exhausted.
How ERPs Actually Forecast Demand — And Why the Math Fails Medical Supply
Most mid-market ERPs (NetSuite, SAP Business One, Sage) use simple moving averages as their default forecasting engine. The logic is straightforward: sum the past 12 months of demand, divide by 52, call it next week's requirement. For a retail SKU that sells 8 to 12 units every day, this works. The variance is low. The pattern is smooth. The model and the reality stay aligned.
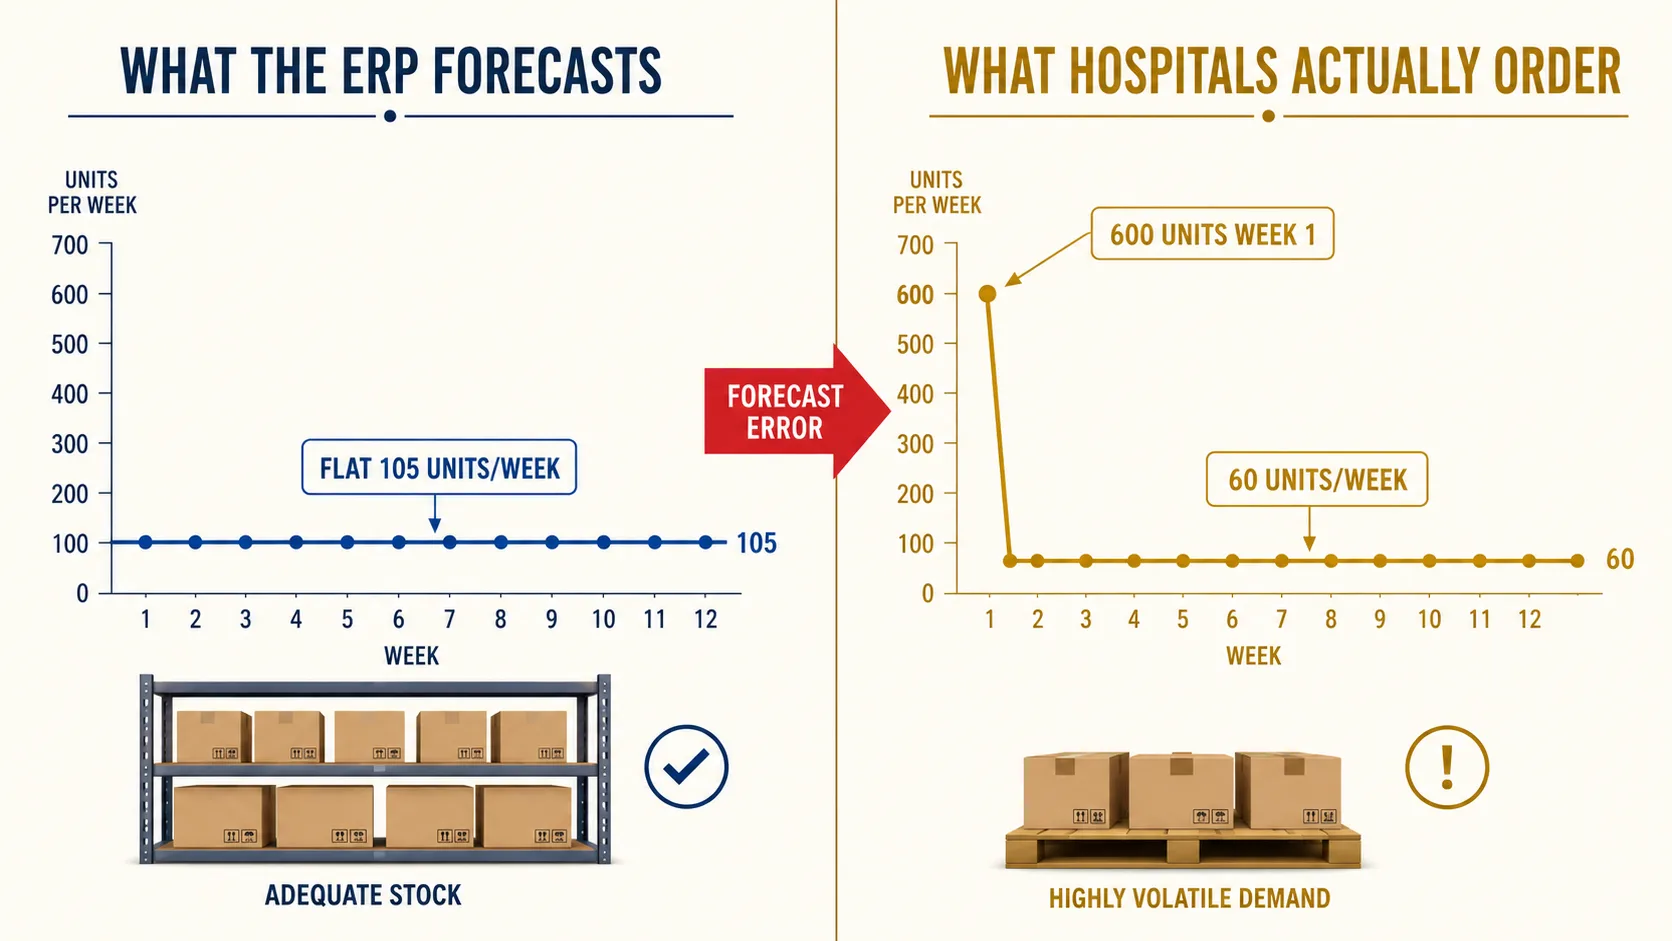
Hospital purchasing does not follow a bell curve. It follows a quarterly bulk cycle: 600 units in week one, 60 units per week for the next 11 weeks. The moving average forecasts 105 units per week. It is perpetually wrong in both directions. In week one the forecast is 82 percent too low and the shelf empties immediately. For the next 11 weeks the forecast is 75 percent too high and the system screams "overstock" while the stock is actually correct for the coming quarter.
This is not a configuration error. It is not a bug. It is not a training gap. The forecasting engine was architected for retail demand patterns: frequent, small, normally distributed transactions. Medical supply distribution has the opposite demand profile: infrequent, large, lumpy institutional orders driven by hospital procurement calendars, not consumer behavior. The model is structurally misaligned with the demand it is modeling. No amount of historical data, parameter tuning, or safety stock padding changes the underlying math.
The Real Cost of Quarterly Stockouts — Beyond Expedited Freight
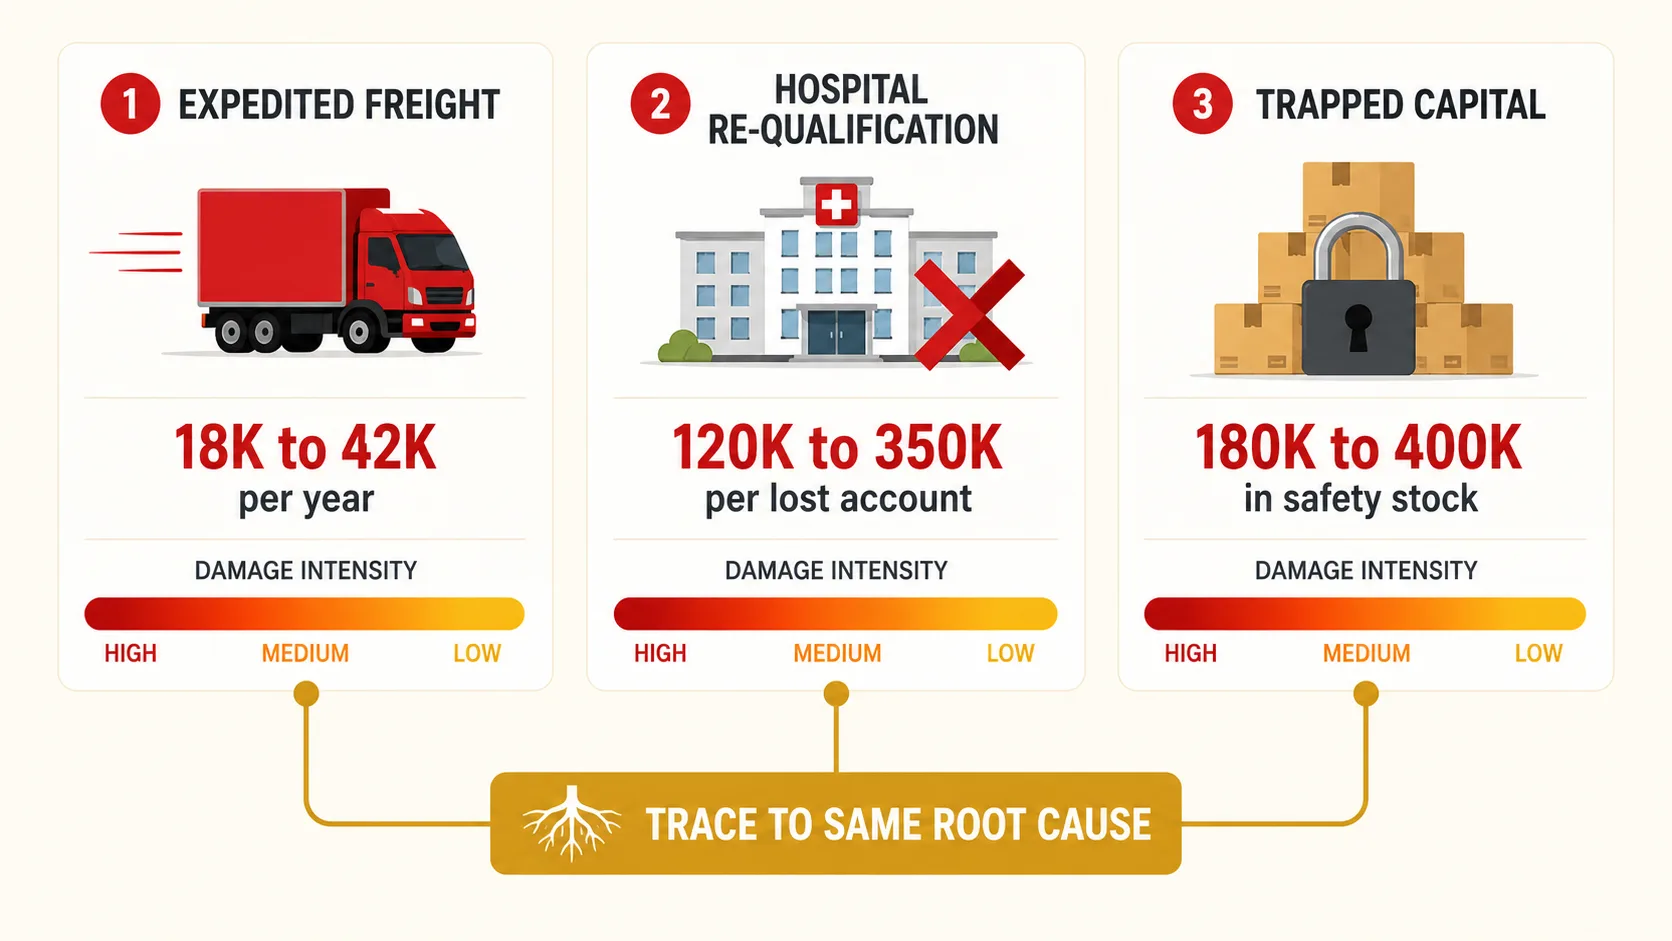
The visible cost is freight. When the quarterly hospital order hits an empty shelf, the distributor pays for UPS Red, courier runs, and spot-buy premiums from competing wholesalers. For a $10 million medical supply distributor, this runs $18,000 to $42,000 per year. That is the number the CFO sees on the freight line item and writes off as "cost of doing business."
The hidden cost is hospital re-qualification risk. When a hospital's surgical schedule depends on a distributor's delivery and the distributor shorts them twice in the same fiscal year, procurement opens a competitive bid. Re-qualifying a lost hospital account costs 4 to 7 times the original margin, according to Harvard Business Review research on customer retention economics. One lost hospital account represents $120,000 to $350,000 in annual revenue. The freight premium is a rounding error compared to what a lost account actually costs.
Then there is the compounding cost: safety stock inflation. Buyers learn quickly that the ERP cannot be trusted for lumpy-demand SKUs, so they manually pad reorder points by 25 to 40 percent. Across 400 affected SKUs at a mid-market distributor, that is $180,000 to $400,000 in trapped working capital. Every manual override adds more buffer. Nobody ever removes one. The inventory bloats quarter after quarter while the stockouts continue because the root cause, the wrong forecasting math, was never addressed.
Why Mid-Market Medical Distributors Accept This Pattern
Medical supply distributors have three options for demand forecasting, and none of them fit. Enterprise planning systems, Blue Yonder and Kinaxis, cost $150,000 or more per year and require dedicated planning teams. For a $5 million to $50 million distributor, that is a non-starter. Spreadsheet forecasting is fragile. It lives on one analyst's laptop, breaks when that analyst leaves, and cannot scale across 2,000 SKUs with different demand patterns. The ERP's built-in forecasting is included in the license cost, already connected to transaction data, and requires no additional implementation. It is the default because the alternatives are worse.
So the industry accepts quarterly stockouts as the cost of doing business. Less expensive than enterprise tools. Less fragile than spreadsheets. This logic is correct about the alternatives. It is wrong that those are the only options. The gap is not in the ERP itself. It is in what sits on top of the ERP and asks a different question: not "what is the average," but "what pattern does this SKU follow, and what math matches that pattern?"
What Demand Pattern Classification Changes in 48 Hours
The first step is classification. Not all SKUs have lumpy demand. Among a medical distributor's 2,000 active SKUs, roughly 200 drive 80 percent of the quarterly stockout events. These are the surgical kits, procedure packs, and high-movement consumables that hospitals order in bulk at quarter start. Identifying them takes about 48 hours of demand pattern analysis: plotting each SKU's transaction history against statistical tests for intermittence and lumpiness.
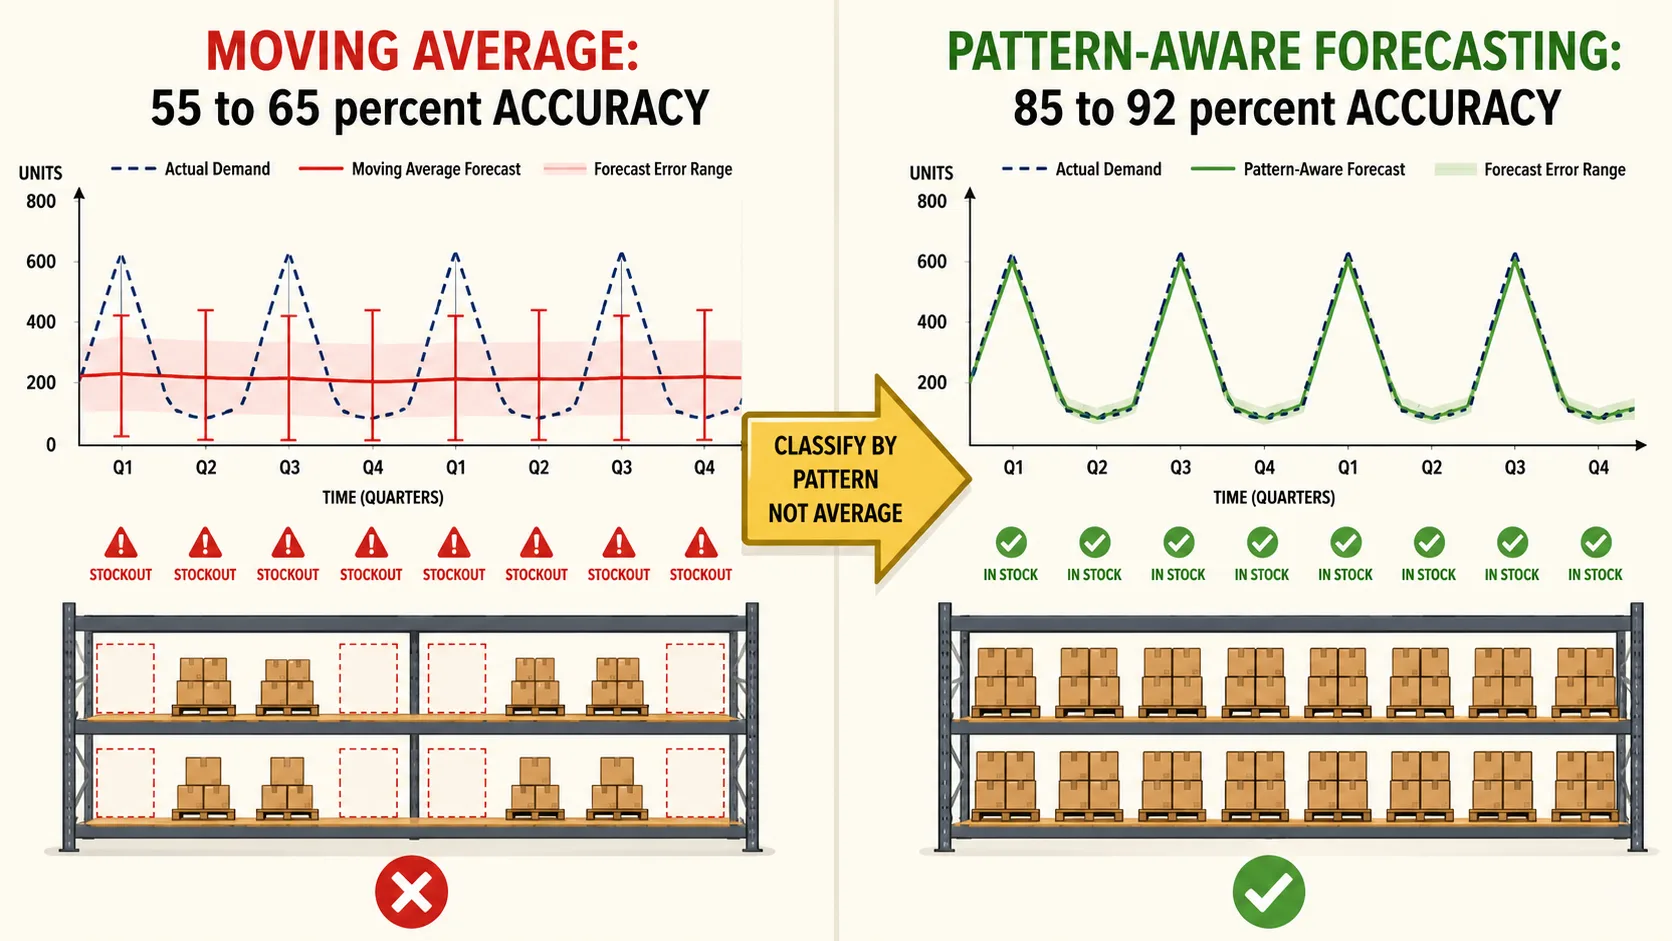
Once those 200 SKUs are isolated, the forecasting math changes. Instead of a simple moving average that averages 12 months into a flat weekly number, an intermittent demand model such as Croston's method separates two variables: how often the SKU moves and how big each movement is. For a surgical kit that ships 600 units every 13 weeks and 60 units in between, the model learns the interval and the magnitude separately. It does not average them together. It preserves the pattern.
For a $12 million distributor running this analysis across the top 200 revenue SKUs, the numbers shift fast. Forecast accuracy on lumpy SKUs improves from 55 to 65 percent to 85 to 92 percent. Expedited freight drops roughly 60 percent within 90 days because the warehouse stocks to the spike, not the average. Between $140,000 and $280,000 in safety stock frees up as buyers stop padding reorder points they no longer need to hedge against. The ERP continues running the business (purchasing, receiving, payables, order management). The demand model just stops it from lying about what is coming.
What to ask next
Common questions operators ask after reading this:
What is intermittent demand forecasting and how does it differ from moving averages?
Why do hospital purchasing patterns cause stockouts that ERPs cannot predict?
How much does expedited freight cost medical supply distributors annually?
What is Croston's method for lumpy demand forecasting?
The quarterly stockout is not an inventory problem. It is a classification problem. The ERP has the data. It lacks the lens to read it. Changing the lens takes 48 hours. The cost of not changing it compounds every quarter, on the same SKUs, for the same reasons. Multi-property demand intelligence that classifies by pattern instead of averaging history identifies which of the top 20 lumpy-demand SKUs the ERP is systematically misforecasting, what the quarterly stockout pattern is actually costing, and what the numbers look like with the correct model applied.