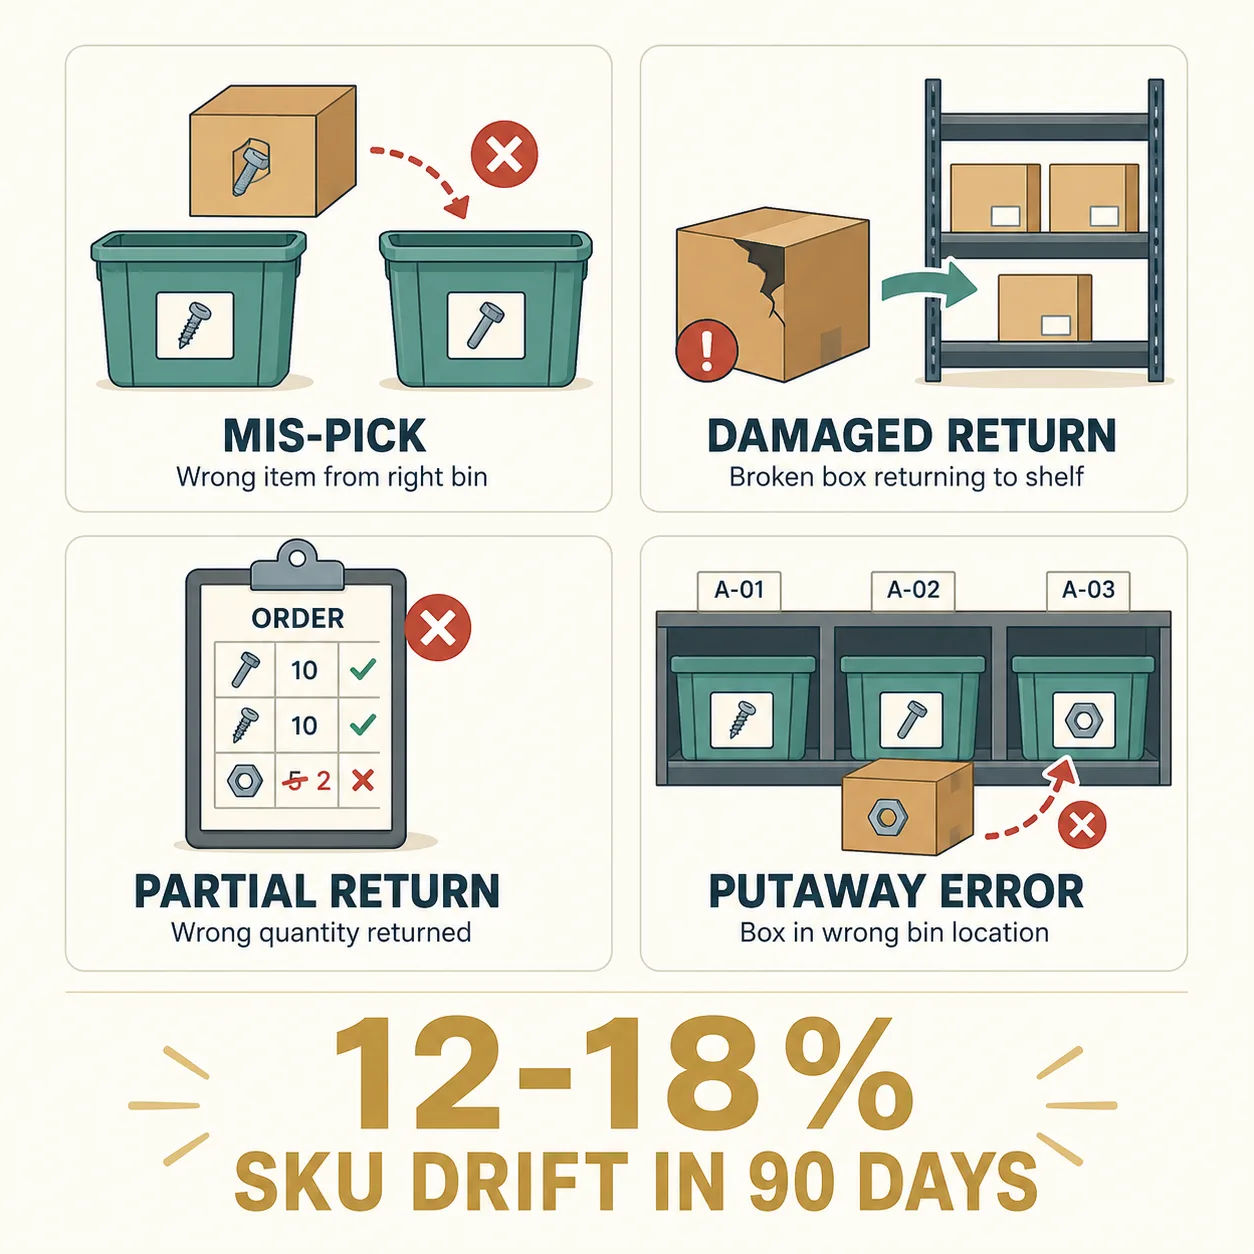
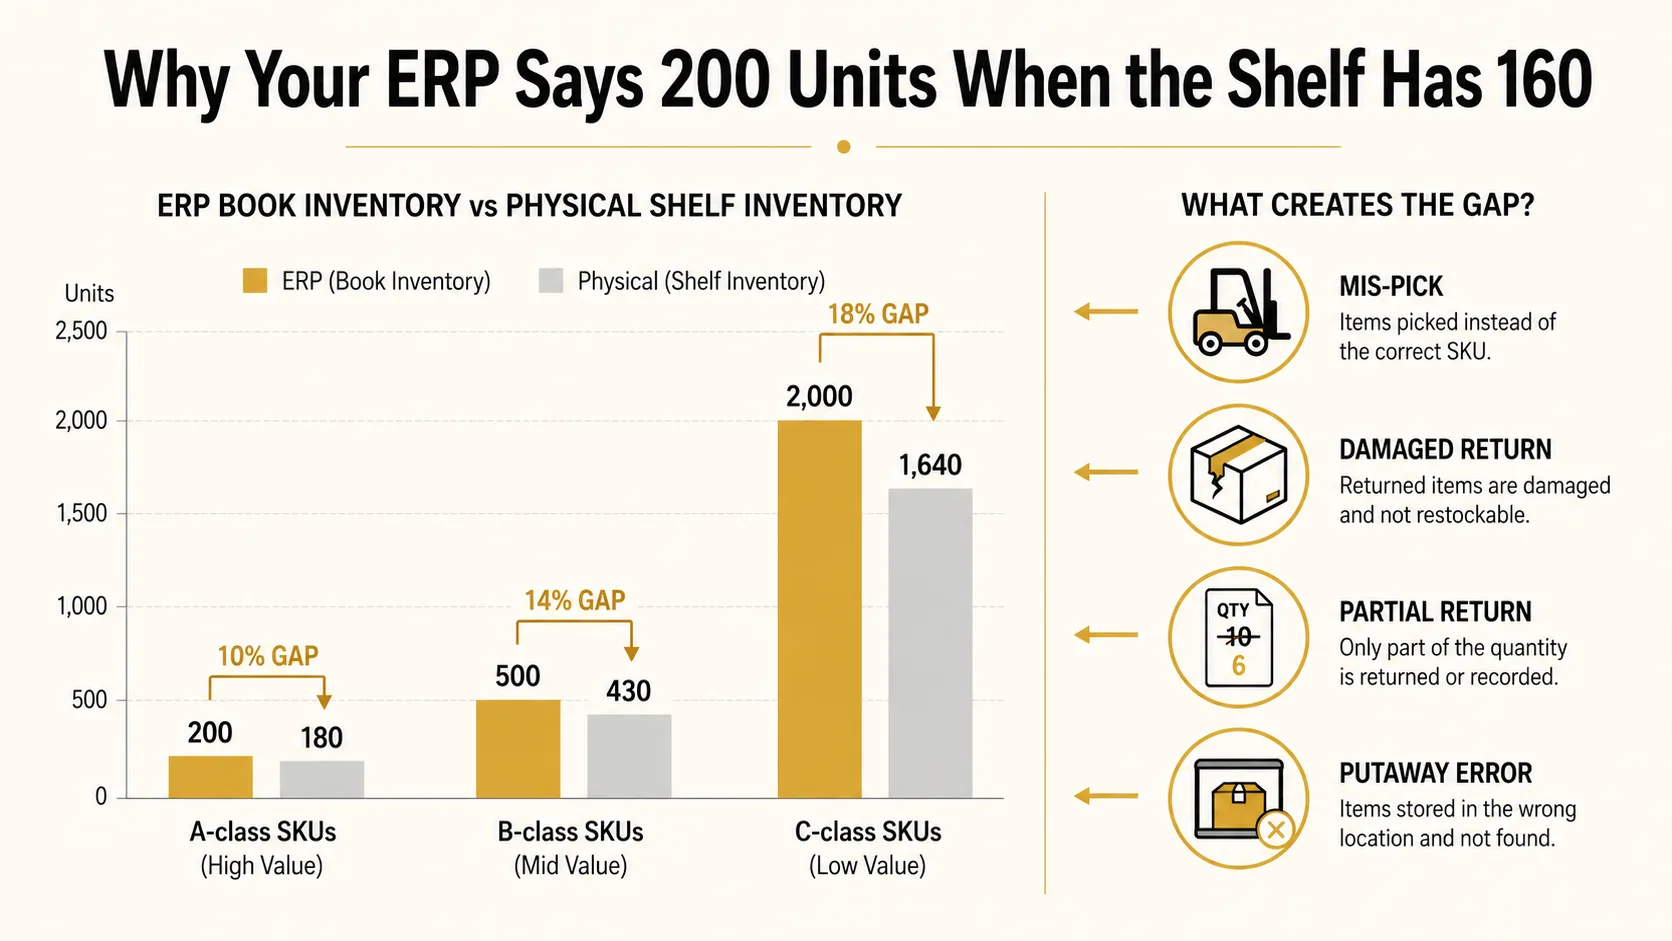
The ERP says 200 and the shelf has 160 because ERP inventory modules record transactions, not physical reality. Every mis-pick, damaged return, and putaway error compounds silently until book stock drifts 12 to 18 percent from the shelf within 90 days.
It is Saturday morning at a $5 million medical supply distributor. The warehouse is silent. No orders to pick. Three clipboard teams walk the aisles counting every shelf, bin, and overstock pallet. By Monday afternoon the report lands: 15 percent of SKUs are off by 10 percent or more. The same thirty to forty SKUs have been off every quarter for two years. Nobody can explain the root cause. The ERP says 200 units. The shelf has 160. Procurement already reordered both based on the ERP number. The quarterly count confirmed what the warehouse manager suspected. It did not prevent a single error from happening again.
Why ERP Inventory Modules Drift From Physical Reality
ERP inventory modules are transactional ledgers, not physical-reality trackers. They debit receipts and credit shipments. Everything between those two events is assumed. The system trusts that what was received matches the PO, that what was picked matches the order, that what was returned is restockable, and that what was put away landed in the correct bin. This trust is wrong roughly 3 to 5 percent of the time per transaction. Individually, a single mis-pick or wrong-bin putaway costs 1 to 3 units. Across 2,000 SKUs and ninety days of receiving, picking, shipping, and returns, the gap compounds to 12 to 18 percent of the book inventory. The ERP has no mechanism to detect this. It was never asked to.
This is the same structural gap Supply Chain Brain identified in June 2026, finding that roughly 60 percent of inventory records are inaccurate at any given point. The root cause is not bad software. It is architecture. ERPs are general ledgers with inventory modules bolted on. They were built to record what happened financially, not to verify what is physically on the shelf. A warehouse management system closes this loop with barcode or RFID validation at every touchpoint . Receiving scan, pick confirmation, putaway verification, return inspection. But WMS installations break even at $150,000 and require warehouse process redesign that mid-market distributors cannot absorb. The gap is not a bug. It is a market failure.
The four process failure points driving the drift are predictable and repeated. Mis-picks at the warehouse: wrong SKU pulled from the right bin. The picker scans the bin location, not the item. The ERP records the bin as depleted. The shelf still holds the wrong product. No system flag is raised. Damaged goods returned without adjustment: a customer returns a damaged unit. Receiving marks the return complete at full quantity. The item goes back to the shelf labeled as sellable. It sits for six months until the next cycle count finds it crushed in box three of pallet seven. Partial returns processed at full quantity: a hospital returns 12 of 20 ordered units. The receiving clerk processes the return as 20. Eight phantom units now exist in the ERP that are not on the shelf. They show as available for the next order. Incorrect putaway: a received pallet of surgical gowns goes to Bin C instead of Bin A. The ERP says Bin A has 80 units. The picker for the next order goes to Bin A and finds 16. The cycle count catches the discrepancy ninety days later.
ERP cycle count modules exist. They schedule counts by ABC classification, track count history, and flag high-variance SKUs for more frequent counting. But they are counting tools, not drift prevention tools. They find the gap after it has already caused damage. The mis-pick that happened on March 3rd does not surface until the June cycle count. By then, the buyer has already reordered the phantom stock. The stockout on the missing SKU has already triggered an expedited freight charge. The cycle count closes the loop on the accounting. It never closed the loop on the operations. As @karxchain observed, inventory accuracy is an event problem, not just a counting problem. If receiving, bin moves, picking, and returns are not captured and validated at the moment they occur, the ERP data will inevitably drift.
What Inventory Accuracy Drift Actually Costs
The obvious cost: $48,000 to $107,000 per year in physical count labor and shrinkage write-offs. A $5 million medical supply distributor spends $30,000 to $65,000 annually on manual cycle count labor alone. Two full-time equivalents tied up for three to five days per quarter confirming what the warehouse team already suspected. When the annual physical count forces full reconciliation, shrinkage write-offs run $18,000 to $42,000. This is inventory the ERP said existed but the warehouse could not locate. It was sold, damaged, returned, mis-picked, or never received. The annual count does not prevent it. It just puts a dollar figure on it.
The hidden cost: $20,000 to $50,000 per year in procurement decisions based on wrong numbers. This is where the drift actually hurts the business. The buyer opens the ERP reorder report. SKU 3927, a high-movement surgical supply, shows 40 units. The reorder threshold is 35. The system says everything is fine. The shelf actually has 12. Three weeks later the stockout hits during a hospital replenishment cycle. Expedited freight to cover the shortage: $1,200. The hospital's materials manager notes the late delivery and starts sourcing the SKU from a competitor. The buyer reorders SKU 1142 because the ERP shows 28 units against a threshold of 30. The shelf holds 140 units. The new order adds another 48 units that join 112 units of existing stock. Carrying cost on the excess: roughly $900 per month in warehousing, insurance, and tied-up capital. The buyer does not know they are working with bad data until the stockout hits or the excess stock gets counted. The ERP reports what it believes. It does not report what it verified.
The compounding cost: compliance audit exposure that threatens supplier contracts. Medical supply distributors operate under FDA 21 CFR Part 820 traceability requirements and GPO quality standards. When an annual physical count reveals greater than 5 percent inventory variance, the finding triggers audit scrutiny. A single failed FDA traceability audit, even one triggered by systematic accuracy drift, not a lot-tracking failure, costs $50,000 to $150,000 in remediation and puts GPO contracts worth $200,000 to $500,000 per year at risk. Building material suppliers face a different version of the same problem. A contractor calls to confirm stock on 300 units of a specific fastener. The ERP says 300. The shelf has 210. The contractor places the order. The supplier cannot fulfill. The contractor switches suppliers the next time. In distribution, inventory accuracy is the relationship.
Why the Industry Normalizes 12 to 18 Percent Variance
The alternatives do not fit the mid-market. WMS systems close the accuracy loop at every touchpoint. Barcode scan at receive, pick, pack, ship, return, and putaway — but they start at $150,000 and require warehouse layout redesign, process retraining, and months of implementation. RFID adds hardware costs of $80,000 or more for readers, tags, and integration. ERP cycle count modules optimize the counting schedule. ABC classification prioritizes high-value SKUs. Count frequency rules ensure variance-prone items get counted more often. But cycle count modules do not detect drift between counts. They do not identify the process failure driving the drift. They tell the warehouse manager which SKUs are off. They never tell them why. So distributors accept 12 to 18 percent variance as "normal shrinkage." They budget for it. Annual physical counts become a cost of doing business, not a symptom of a structural gap. The industry has normalized inaccurate inventory because the fix has always required a WMS-sized investment. Nobody built a mid-market answer. The gap exists because the companies building operational intelligence for this segment focus on software that replaces ERPs, not software that verifies them.
The dynamic is perverse. The same SKUs that drift the most get counted the most. ABC classification flags them as high-variance, which triggers more frequent counting, which confirms the variance exists, which categorizes them as high-variance. The counting never fixes the process. It just measures the damage on a tighter loop. A warehouse manager watching the same thirty SKUs come back wrong every quarter eventually stops being surprised. They just add the variance to the budget and move on. The organization has stopped asking why the shelf and the ERP disagree. It just pays to count the gap every ninety days and writes off the difference at year-end.
What Changes When Continuous Monitoring Replaces Periodic Counting
A lightweight reconciliation system — sitting on top of the existing ERP, not replacing it — changes the math. The system monitors every inventory transaction: receipt, pick, shipment, return, putaway, bin transfer, adjustment. It compares what the ERP recorded against what the pattern of transactions predicts should be on the shelf. When a SKU drifts beyond a statistical threshold — not a fixed count threshold, but a pattern-based anomaly flag. The system alerts within 48 hours. Not ninety days at the next cycle count.
The system identifies the 3 to 5 process failure points driving 70 percent of the variance. The mis-pick pattern on high-movement surgical supplies during the second shift. The putaway error on bulk MRO fasteners arriving from a specific supplier. The returns-processing gap on medical devices where partial returns are booked at full quantity. Each of these is a process failure, not a counting failure. The cycle count finds them. The reconciliation system prevents them from compounding. The warehouse manager stops discovering variance and starts fixing the processes that create it.
The numbers change fast: physical count labor drops 60 percent because counting shifts from a discovery mechanism to a verification mechanism. Shrinkage write-offs fall 40 to 55 percent because errors are caught within two days, not two quarters. Procurement decisions start from numbers that match the shelf. The phantom stockout that triggers a re-qualification audit never happens because the stockout was real — the inventory was missing. And the system caught it before the buyer reordered from bad data. Most importantly, the buyer opens the ERP and sees numbers that reflect the warehouse. Not what the ERP recorded three months ago. What is actually there.
This is the core shift. ERPs are not wrong. They are incomplete. They record what happened. They do not verify what happened. The reconciliation system does what the ERP was never asked to do — close the loop between the transaction and the physical reality. It is not a WMS. It is not RFID. It is not a cycle count schedule. It is the verification step the industry's tools have been missing because the only options that included it required a $150,000 WMS. The mid-market does not need a WMS. It needs to know when its ERP is lying.
What to ask next
Common questions operators ask after reading this:
How much inventory accuracy drift is normal in medical supply distribution?
What causes ERP inventory to diverge from physical counts between cycles?
How do medical suppliers pass FDA inventory traceability audits with drifting ERP data?
What is the cost difference between quarterly cycle counting and continuous inventory monitoring?
Related read: Returns create the same phantom availability through a different door. When a credit memo posts, the ERP marks returned goods available while inspection takes 3 to 14 days, and quarantine blind spots trigger $28K-$64K in unnecessary re-purchases.
Get a diagnostic of inventory drift patterns →
Send us the last 12 months of cycle count data. The report identifies the 5 SKUs where accuracy drift is costing the most and show the specific process failure driving each one. No WMS. No RFID hardware. A diagnostic that tells operators what their ERP cannot see — which SKUs are drifting, why, and what to fix before the next audit.